
Fig. 3
- ID
- ZDB-FIG-181024-21
- Publication
- Swaminathan et al., 2018 - Non-canonical mTOR-Independent Role of DEPDC5 in Regulating GABAergic Network Development
- Other Figures
- All Figure Page
- Back to All Figure Page
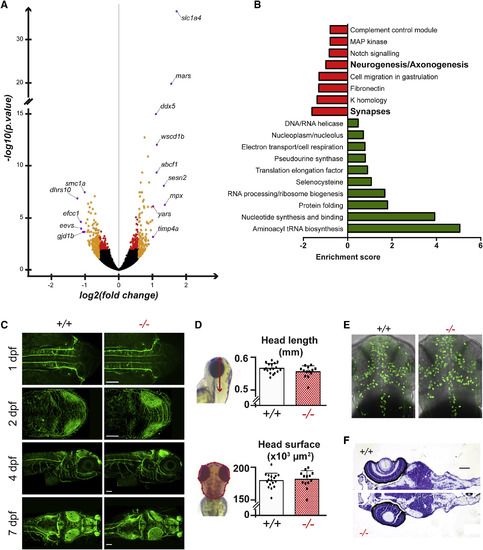
depdc5 Knockout Alters Gene Expression in Larval Brains without Affecting Brain Morphology (A) Volcano plot showing the differentially expressed gene expression profile between depdc5+/+ and depdc5?/? larval brains. See also Table S1. (B) Pathways showing high enrichment in the differentially expressed genes (upregulated are shown in green; downregulated are in red). (C) Whole-mount images of depdc5+/+ and ?/? larvae at different stages of development immunostained with ?-acetylated tubulin (n > 3/genotype/developmental stage). Scale bars, 40 ?m. (D) Measurement of head size and head surface area in 3-dpf depdc5+/+ and depdc5?/? larvae. (E) Whole-mount images of 48-hpf depdc5+/+ and ?/? larvae immunostained with ?-phosphorylated histone H3 (n > 3/genotype). (F) Cresyl violet staining comparing 7-dpf depdc5+/+ (top half) and depdc5?/? (bottom half) larval heads showed no gross difference in the density of cells in the brain. Scale bar, 100 ?m. |
| Antibody: | |
|---|---|
| Fish: | |
| Anatomical Term: | |
| Stage Range: | Prim-5 to Days 7-13 |
| Fish: | |
|---|---|
| Observed In: | |
| Stage Range: | Prim-5 to Days 7-13 |