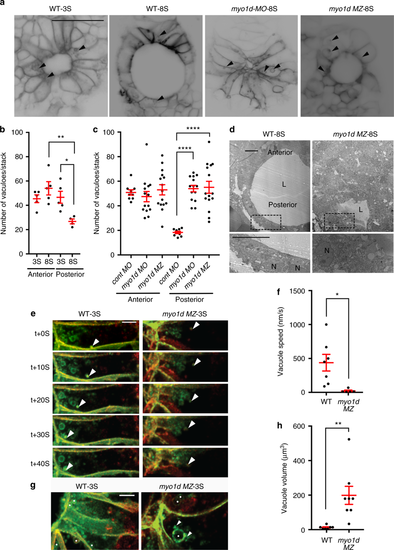
myo1d regulate directed vacuolar movement in KV cells. a?c Anterior and posterior KV epithelial cells contain numerous vacuoles (black arrow) at 3S (n?=?5 embryos) but decrease in the posterior KV cells at 8S (n?=?5 embryos) in Tg(dusp6:GFP-MA) embryos (scale bar, 50?�m). Vacuole number in posterior KV cells were increased in myo1d MO injected (n?=?14) or in myo1d MZ;Tg(dusp6:GFP-MA) mutants (n?=?15) when compared to control MO injected embryos (n?=?9). Numeration of vacuole number per KV stack are shown in b and c. d TEM showing presence of vacuoles (black arrow) in posterior KV apex in myo1d MZ but not in WT embryos at 8S. L lumen, N nucleus, (n?=?4) (scale bar, 10?�m). e?h 4D STED time-lapse still images of a representative KV epithelial cell. Tg(dusp6:GFP-MA) KV injected with H2BmCherry mRNA showing directed vacuole migration toward apical surface (white arrow), appeared to fuse with luminal surface. Vacuole movement toward KV apex in the myo1d MZ;Tg(dusp6:GFP-MA) mutant were decreased (e). Average vacuole movement speed in KV epithelial cells in myo1d MZ mutants (n?=?5 vacuoles from three embryos) were decreased compared to WT (n?=?7 vacuoles from three embryos) (f). In myo1d MZ;Tg(dusp6:GFP-MA) embryos (n?=?7 vacuoles from three embryos), vacuole fusion (shown as white arrow) resulted in increased vacuole size when compared to Tg(dusp6:GFP-MA) control (n?=?8 vacuoles from three embryos) (g). Vacuoles denoted by white spots. Average vacuole volume was increased in KV epithelial cells (h). Statistical analysis by one-way ANOVA and post hoc analysis with Turkey?s multiple range tests or unpaired t test. * p?<?0.05, **p?<?0.01, ***p?<?0.005, ****p?<?0.0001 represents a statistical difference. Data shown are mean?�?SEM. Scale bar, 5?�m
|
