
Fig. 6
- ID
- ZDB-FIG-180911-37
- Publication
- Muralidharan et al., 2018 - Retinal Wnt signaling defect in a zebrafish fetal alcohol spectrum disorder model
- Other Figures
- All Figure Page
- Back to All Figure Page
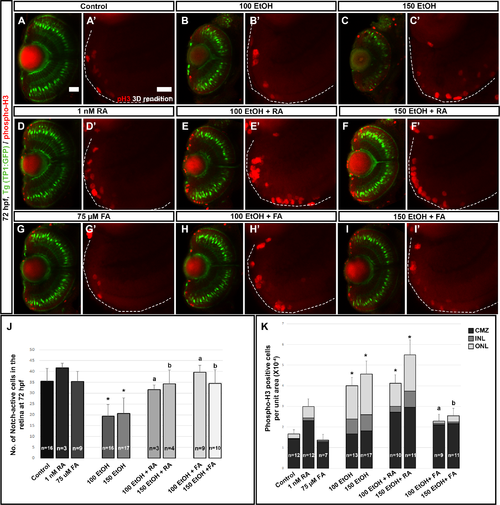
RA, but not FA, co-supplementation induces proliferation. (A-I) PhosphoH3 (red) staining of Tg(TP1:gfp), (green cells) larvae showed that ethanol exposure induced proliferation in the CMZ, INL and ONL. (A?-I?) 3D rendition of phosphoH3 staining in the peripheral retinal region showed the increase in proliferation in ethanol treated larvae (B?, C?) which was increased after RA treatment (D?,E?, F?) and rescued after FA co-supplementation (G?, H?, I?). (J) Quantification of mCherry-positive (Notch-active cells) in the retina showed a significant rescue of notch signaling after both RA and FA co-supplementation. (K) Quantification of phosphoH3-positive cells per unit area at 72 hpf showed statistically significant increase in phosphoH3-positive cells in after ethanol treatment which was rescued after FA co-supplementation. Numbers of cells were counted in a single optic-nerve containing confocal optical section in the ventral CMZ. White dashed lines indicate RPE of the retina. Images show rostral at top, lateral at left. Error bars indicate standard deviation. ?*? indicates statistical significance in comparison to control embryos (p<0.05). ?a? indicates statistical significance in comparison to 100 mM ethanol embryos (p<0.05). ?b? indicates statistical significance in comparison to 150 mM ethanol embryos (p<0.05). Scale bar = 20 ?m for panels A-I. Scale bar = 10 ?m for A?-I?. |
| Fish: | |
|---|---|
| Conditions: | |
| Observed In: | |
| Stage: | Protruding-mouth |