
FIGURE
Fig. 9
- ID
- ZDB-FIG-180802-17
- Publication
- Spead et al., 2018 - Characterization of the caspase family in zebrafish
- Other Figures
- All Figure Page
- Back to All Figure Page
Fig. 9
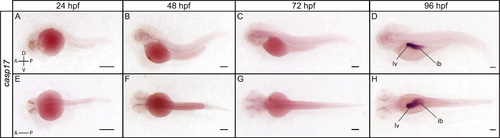
Spatial expression of casp17 at 24, 48, 72 and 96 hpf. Lateral (A-D) and dorsal (E-H) views of a whole embryo stained for casp17 by ISH show a strong and specific expression of casp17 in the liver (lv) and intestinal bulb (ib) at 96 hpf (D, H). Scale bar: 200 ?m. |
Expression Data
| Gene: | |
|---|---|
| Fish: | |
| Anatomical Terms: | |
| Stage: | Day 4 |
Expression Detail
Antibody Labeling
Phenotype Data
Phenotype Detail
Acknowledgments
This image is the copyrighted work of the attributed author or publisher, and
ZFIN has permission only to display this image to its users.
Additional permissions should be obtained from the applicable author or publisher of the image.
Full text @ PLoS One