Fig. 1
|
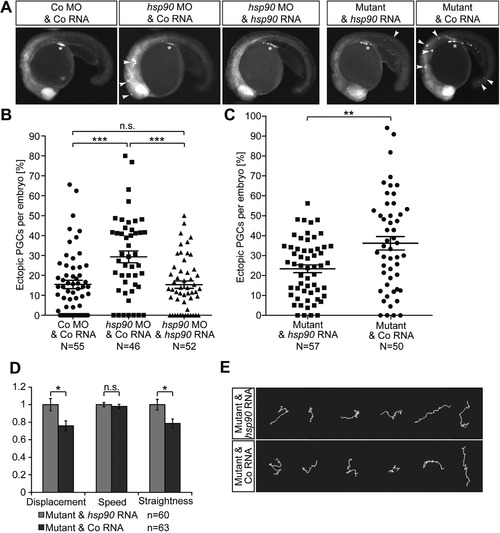
Hsp90aa1.2 function is important for the arrival of PGCs at their migration target. (A) Images of Hsp90aa1.2-knockdown embryos, hsp90aa1.2 mutants and controls. Arrowheads, ectopic PGCs. Asterisk, migration target. The PGCs are labeled with farnesylated EGFP. (B) Scatter plot presenting the quantitation of the antisense oligonucleotide knockdown experiments displayed in the three left panels in A. For the rescue, hsp90aa1.2 RNA was expressed in the PGCs by fusing the open reading frame to the 3?UTR of the nanos3 gene. Data derived from three experiments. Statistical analysis calculated using Mann-Whitney-test: Co MO&Co RNA to hsp90aa1.2 MO&Co RNA: p?=?0.0002; hsp90aa1.2 MO&Co RNA to hsp90aa1.2 MO&hsp90aa1.2 RNA: p?=?0.0002; Co MO&Co RNA to hsp90aa1.2 MO&hsp90aa1.2 RNA: p?=?0.839. N represents the number of embryos analyzed. (C) Scatter plot presenting the quantitation of the results derived from the analysis of hsp90aa1.2 mutant embryos, injected with Control RNA or hsp90aa1.2-nanos3 3?UTR RNA expressed in the PGCs that reverses the phenotype. Data represent six independent experiments; mutant alleles used for this were four times the hsp90aa1.2d34, one time the hsp90aa1.2d5 and one time the hsp90aa1.2in1. Statistical analysis with Mann-Whitney-test resulted in p?=?0.0063. N represents the number of embryos analyzed. (D) Bar graphs of migration parameters of PGCs from mutant embryos injected with Control RNA or hsp90aa1.2 RNA. The mean of the different parameters measured in mutant embryos are compared with those measured in the mutant embryos supplemented with hsp90aa1.2-nanos3 3?UTR RNA. Results derived from four experiments; two experiments carried out with the hsp90aa1.2d34 line and the other two experiments carried out with the hsp90aa1.2in1 fish line. Statistics analyzed with stratified Kruskal-Wallace-test for displacement: p?=?0.03286; speed: p?=?0.1323; straightness: p?=?0.0215. n is the number of PGCs. (E) Representative tracks of migrating PGCs in 6?8?hpf embryos in hsp90aa1.2 mutant embryos injected with control RNA, or with hsp90aa1.2-nanos3 3?UTR RNA that reverses the phenotype. n.s. = not significant, error bars indicate SEM. |
| Fish: | |
|---|---|
| Knockdown Reagent: | |
| Observed In: | |
| Stage Range: | Shield to 20-25 somites |
Reprinted from Developmental Biology, 436(2), Pfeiffer, J., Tarbashevich, K., Bandemer, J., Palm, T., Raz, E., Rapid progression through the cell cycle ensures efficient migration of primordial germ cells - the role of Hsp90, 84-93, Copyright (2018) with permission from Elsevier. Full text @ Dev. Biol.

