|
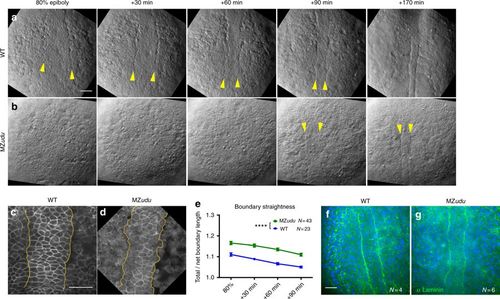
MZudu mutant gastrulae exhibit irregular notochord boundaries. a?b Still images from live Nomarski time-lapse series of the dorsal mesoderm in WT (a) and MZudu?/? embryos (b) at the time points indicated. Images are representative of over 40 MZudu?/? gastrulae. Arrowheads indicate notochord boundaries. c?d Live confocal microscope images of representative WT (c, N?=?23) and MZudu?/? (d, N?=?43) embryos expressing membrane Cherry. Yellow lines mark notochord boundaries. e Quantification of notochord boundary straightness in live WT and MZudu?/? gastrulae throughout gastrulation. Symbols are means with SEM (two-way ANOVA, ****p?<?0.0001). f?g Confocal microscope images of immunofluorescent staining for pan-Laminin in WT (f) and MZudu?/? (g) embryos at two-somite stage. N indicates the number of embryos analyzed. Scale bars are 50??m. Anterior is up in all images
|