
Fig. 3
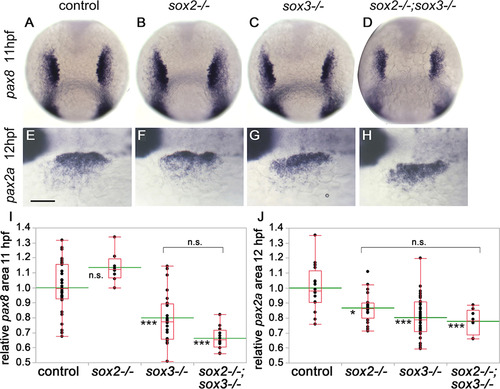
Effect ofsox2-/-andsox3-/-on early placode size. (A-H) Expression of pax8 at 11 hpf (A-D) and pax2a at 12 hpf (E-H) in control embryos (A, E), sox2-/- mutants (B, F), sox3-/- mutants (C, G) and sox2-/-; sox3-/- double mutants (D, H). Dorsal views with anterior up (A-D) or dorsal-lateral views with anterior to the left (E-H). Scale bar (E-H), 100 �m. (I, J) Box-and-whisker plots of relative surface area of otic/epibranchial domain of pax8 (I) or pax2a (J) in control, sox2-/-, sox3-/- and sox2-/-; sox3-/- double mutant embryos. Data are normalized relative to control groups, with means indicated by green lines. Asterisks indicate statistically significant differences relative to control (*P<0.05, *** P<0.001, Tukey's HSD test). Brackets indicate comparisons between non-control groups. n.s., not significantly different. |
| Genes: | |
|---|---|
| Fish: | |
| Anatomical Term: | |
| Stage Range: | 1-4 somites to 5-9 somites |
| Fish: | |
|---|---|
| Observed In: | |
| Stage Range: | 1-4 somites to 5-9 somites |
Reprinted from Developmental Biology, 435(1), Gou, Y., Guo, J., Maulding, K., Riley, B.B., sox2 and sox3 cooperate to regulate otic/epibranchial placode induction in zebrafish, 84-95, Copyright (2018) with permission from Elsevier. Full text @ Dev. Biol.