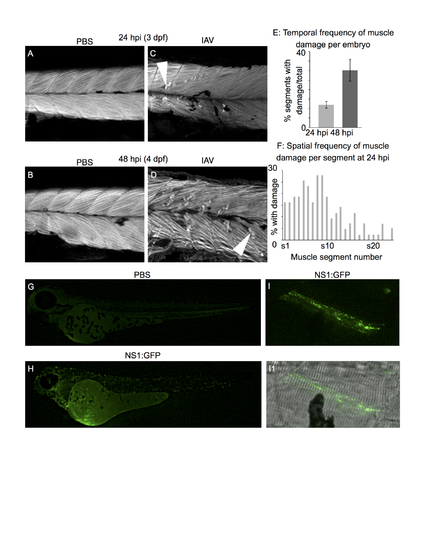
Human IAV infects zebrafish muscle cells and causes muscle fiber damage All embryo images are side mounts, dorsal top, anterior left. Panels A-D are phalloidin stained to visualize F-actin. White arrowheads denote retracted fibers. (A) PBS-injected control at 24 hpi (3 dpf). (B) PBS-injected control at 48 hpi (4 dpf). (C) IAV-infected embryo at 24 hpi. (D) IAV-infected embryo at 48 hpi. (E) Quantification of the proportion of muscle segments per embryo with damaged fibers in IAV-infected embryos over developmental time. Fiber damage is more frequently observed at 48 hpi than at 24 hpi. (F) Spatial location of damaged fibers along the anterior-posterior axis of IAV-infected embryos at 24 hpi. The frequency of damaged fibers peaks in segments 5-9, which is in the anterior of the fish near the Duct of Cuvier (the site of injection). (G) PBS-injected control at 24 hpi (3 dpf). (H) NS1-GFP-injected zebrafish at 24 hpi. Note the punctate green fluorescence in infected cells throughout the body. (I) NS1-GFP-injected zebrafish at 24 hpi. Higher magnification view of a GFP-positive, infected muscle fiber. (I1) Merged panel of NS1-GFP and brightfield images.
|
