
FIGURE
Fig. s17
- ID
- ZDB-FIG-180404-23
- Publication
- Louie et al., 2017 - Temporally distinct transcriptional regulation of myocyte dedifferentiation and Myofiber growth during muscle regeneration
- Other Figures
- All Figure Page
- Back to All Figure Page
Fig. s17
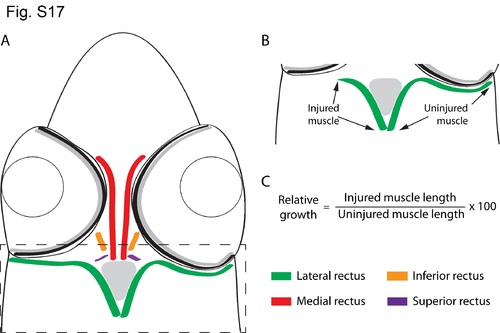
Diagram of zebrafish EOMs. Sketch of a zebrafish head coronal section depicting the extraocular muscles visualized by the craniectomy technique (A). The dashed box in A approximately shows the picture used for regeneration assessment. Diagram of a regeneration assessment picture showing injured and uninjured muscles (B). Formula used to calculate the relative growth of the injured muscle (C). |
Expression Data
Expression Detail
Antibody Labeling
Phenotype Data
Phenotype Detail
Acknowledgments
This image is the copyrighted work of the attributed author or publisher, and
ZFIN has permission only to display this image to its users.
Additional permissions should be obtained from the applicable author or publisher of the image.
Full text @ BMC Genomics