
FIGURE
Fig. s15
- ID
- ZDB-FIG-180404-21
- Publication
- Louie et al., 2017 - Temporally distinct transcriptional regulation of myocyte dedifferentiation and Myofiber growth during muscle regeneration
- Other Figures
- All Figure Page
- Back to All Figure Page
Fig. s15
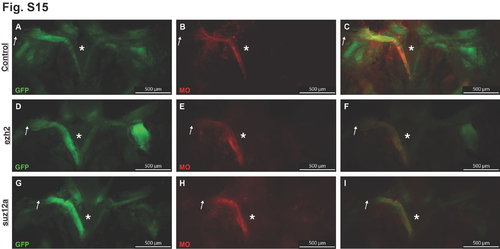
Morpholino knockdown of gene expression. Related to Fig. 5. Craniectomy was performed to visualize EGFP-labeled muscle at 8 dpi. Brain was removed to allow visualization of the skull base (*) Microinjected MOs are detected throughout the entire regenerating muscle, including the distal ends (white arrow). Most MOs targeting specific mRNA decreased muscle regeneration at 8 dpi. Control MO (shown again for comparative purposes), ezh2 and suz12a MO injected fish are shown, Fig. 5 shows the fn1a MO. |
Expression Data
Expression Detail
Antibody Labeling
Phenotype Data
Phenotype Detail
Acknowledgments
This image is the copyrighted work of the attributed author or publisher, and
ZFIN has permission only to display this image to its users.
Additional permissions should be obtained from the applicable author or publisher of the image.
Full text @ BMC Genomics