
FIGURE
Fig. s1
Fig. s1
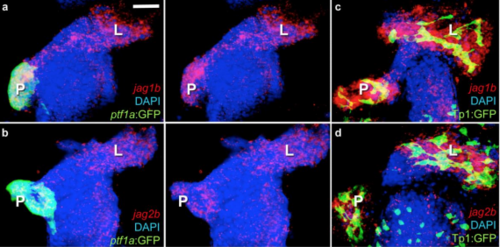
Supplementary Figure 1. jag1b and jag2b expression in the developing pancreas and liver. Ventral view, 3D confocal rendering of whole mount fluorescent in situ hybridization detecting jag1b and jag2b expression in ptf1a:GFP (green, pancreas) 56 hpf embryo (a-b, panels to right with GFP channel removed) and Tp1:GFP (green) 72 hpf embryos (c-d). mRNA expression of jag1b (a, c) and jag2b (b, d) is prominent in both the liver (L) and pancreas (P). Representative samples, n= 4 each. Scale bars 50?M. |
Expression Data
Expression Detail
Antibody Labeling
Phenotype Data
Phenotype Detail
Acknowledgments
This image is the copyrighted work of the attributed author or publisher, and
ZFIN has permission only to display this image to its users.
Additional permissions should be obtained from the applicable author or publisher of the image.
Full text @ Nat. Commun.