
FIGURE
Fig. 8
Fig. 8
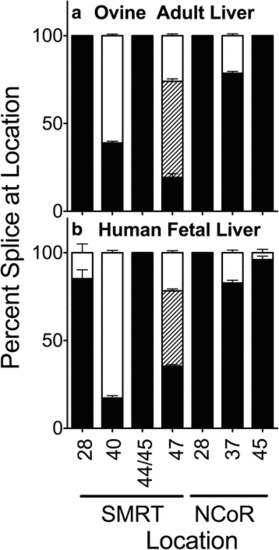
Alternative splicing in ovine and human liver. Livers were isolated, RNA was extracted, and the alternative splicing at the indicated locations was analyzed and is presented graphically as in Figs. 2 and 4. Mean and standard deviation are shown (n?=?3) for each. Panels represent ovine adult liver (a) and human fetal liver (b) |
Expression Data
Expression Detail
Antibody Labeling
Phenotype Data
Phenotype Detail
Acknowledgments
This image is the copyrighted work of the attributed author or publisher, and
ZFIN has permission only to display this image to its users.
Additional permissions should be obtained from the applicable author or publisher of the image.
Full text @ BMC Evol. Biol.