
Fig. 2
- ID
- ZDB-FIG-171206-84
- Publication
- Wan et al., 2017 - Characterization of ?? T Cells from Zebrafish Provides Insights into Their Important Role in Adaptive Humoral Immunity
- Other Figures
- All Figure Page
- Back to All Figure Page
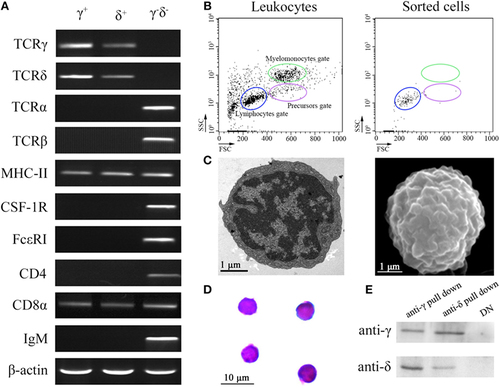
Cellular and molecular identification of zebrafish ?? T cells. (A) RT-PCR assay analyzed the expression of T cell markers (?, ?, ?, ?, CD4, and CD8), antigen-presenting cell marker (MHC-II), B cell marker (mIgM), and myeloid cell (monocyte/macrophage and dendritic cell) markers (CSF-1R and Fc?RI). The expressions of these markers from negative selection cells were used as control. (B) FCM analyzed the FSC/SSC profiles of leukocytes and the sorted cells. (C) Transmission electron microscopy and scanning electron microscopy show the detailed morphologies of sorted ?? T cells. Scale bar 1 �m (bottom left). (D) Wright-Giemsa staining indicates the morphologies of the sorted ?? T cells. Scale bar 10 �m (bottom left). Original magnification �1,000. (E) Detect the expressions of ? and ? in the anti-? and anti-? pull down cells, respectively, by Western blot. |