
Fig. 6
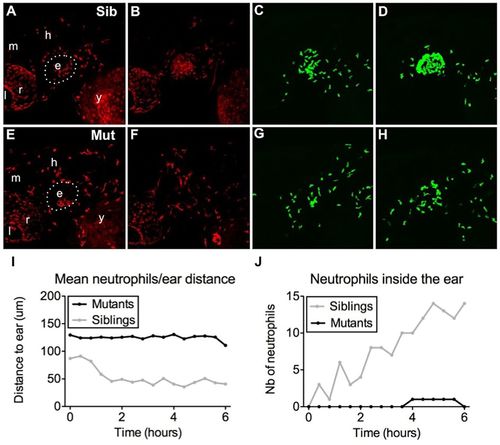
Bacterial infection is insufficient to recruit mutant myeloid cells. (A?H) In vivo time-lapse imaging of macrophages (A,B,E,F) and neutrophils (C,D,G,H) of monNQ039Tg(mpeg1:mCherry/mpx:gfp) sibling (Sib) (A?D) and mutants (Mut) (E?H) by 60?hpf, 20?min after E. coli injection in the inner ear (A,C,E,G) or 7?h later (B,D,F,H). Bacteria injection in the ear induces a strong recruitment of both macrophages and neutrophils in the siblings (B,D), but almost none in the moonshine mutant (F,H). e, ear; l, lens; r, retina; m, midbrain; h, hindbrain; y, yolk sac. See also Movie 7. (I,J) Quantification of neutrophil mean distance to the ear following injection of GFP-positive B. subtilis in the inner ear by 72?hpf (I) shows a drop during the first 2 hours post injection in the siblings (light curve) and not in the mutant (black curve); accordingly, the number of neutrophils inside the ear of infected larvae constantly increases over time in the siblings (light curve) but not in the mutant (black curve). See also Movie 8. |
| Fish: | |
|---|---|
| Conditions: | |
| Observed In: | |
| Stage: | Protruding-mouth |