
Fig. S2
- ID
- ZDB-FIG-170807-28
- Publication
- Passoni et al., 2017 - Imaging of viral neuroinvasion in the zebrafish reveals that Sindbis and chikungunya viruses favour different entry routes
- Other Figures
- All Figure Page
- Back to All Figure Page
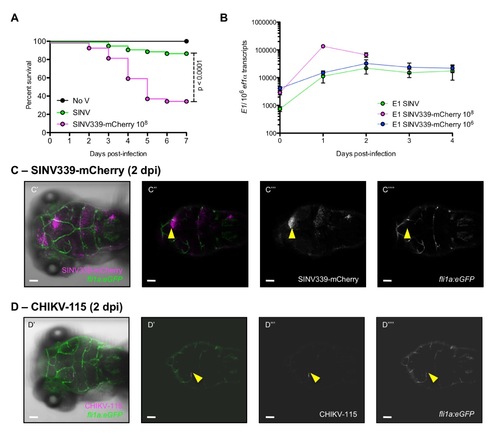
Infection of zebrafish larvae with other SINV and CHIKV strains. (A and B) Characterization of SINV339-mCherry strain in zebrafish WT larvae. (A) Survival curves of control uninfected (No V) and SINV- or SINV339-mCherry infected zebrafish larvae. Data pooled from 5 independent experiments. N = 60 larvae per group. (B) Expression levels of E1 SINV gene, measured via qRT-PCR, for SINV and SINV339-mCherry (2 different concentrations). Note that at the highest concentration, all SINV339-mCherry infected larvae had succumbed at 2 dpi. (C and D) Confocal image of WIHC processed SINV339-mCherry (C) and CHIKV-115 (D) infected fli1a:eGFP larvae, (C' and D') maximal projection. Scale bars: 50 ?m. (C'-C'''') SINV-infected cells in magenta; vasculature in green. (C'') merge of magenta (infected cells) and green (endothelium) fluorescence from a single focal plane; (C''') magenta (infected cells) fluorescence; (C'''') green (endothelium) fluorescence. Yellow arrowheads: infected areas close to but not part of the vasculature. (D'') merge of magenta (infected cells) and green (endothelium) fluorescence from a single focal plane; (B''') magenta (infected cells) fluorescence; (B'''') green (endothelium) fluorescence. Yellow arrowheads: areas of colocalization. |