
Fig. 2
- ID
- ZDB-FIG-170807-22
- Publication
- Passoni et al., 2017 - Imaging of viral neuroinvasion in the zebrafish reveals that Sindbis and chikungunya viruses favour different entry routes
- Other Figures
- All Figure Page
- Back to All Figure Page
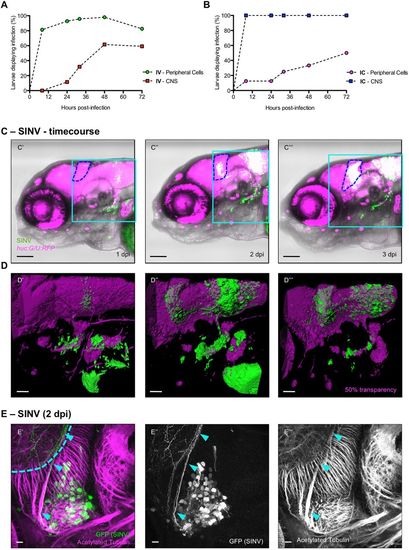
SINV is neuroinvasive in zebrafish larvae. (A,B) Quantification of the appearance of infected cells in the periphery (circles) and in the CNS (squares), from in vivo observation of huC:G/U:RFP larvae, following IV (A) or IC (B) inoculation. n=12-24 from two independent experiments pooled. (C?-C?) Live confocal imaging of the same IV SINV-infected huc:G/U:RFP larva from 1 to 3?dpi, showing the progression of the infection. Superposition of transmitted light, green (infected cells) and red (neurons) fluorescence; blue dotted line, cerebellum. In this and following colour figures, red fluorescence is displayed in magenta and referred to as ?magenta fluorescence?. The light blue squares correspond to regions shown in panels D?-D?. Scale bars: 50?�m. (D?-D?) 3D rendering of the brain areas shown above. Scale bars: 25?�m. (E?-E?) Confocal image of a whole-mount immunohistochemistry processed SINV-infected WT larva, maximal projection. GFP staining (SINV-infected cells) in green; acetylated tubulin (axons) in magenta. Infected cells are in the trigeminal ganglion (TG); the axon-rich region visible behind (light blue dotted line) is the neuropile of the left optic tectum (OT). Light blue arrowheads point to the axon of an infected neuron connecting the TG to the OT. Scale bars: 10?�m. |
| Gene: | |
|---|---|
| Antibody: | |
| Fish: | |
| Condition: | |
| Anatomical Terms: | |
| Stage Range: | Day 4 to Days 7-13 |