
FIGURE
Fig. S1
Fig. S1
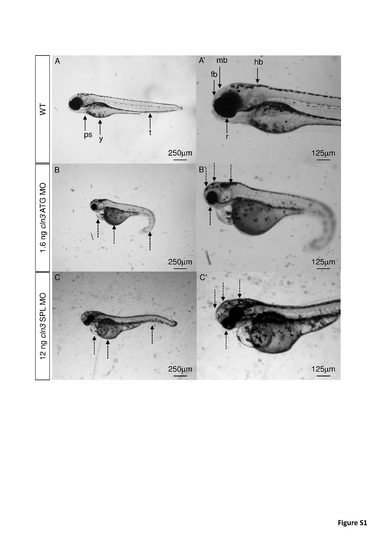
Abnormal morphology was observed using two different cln3 morpholinos at 4 dpf. (A, A') WT. (B, B') 1.6 ng cln3 ATG MO. (C, C') 12 ng cln3 SPL MO. Morphant larvae (B, B', C, C') showed small retinas, small brain, pericardial oedema, a large yolk sac and abnormal tail curvature (dashed arrows) compared to WT (A, A'). Abbreviations: r, retina; ps, pericardial sac; y, yolk; t, tail; fb, forebrain; mb, midbrain; hb, hindbrain. Lateral views. Anterior to left. Dorsal up. Scale bars: A-C 250 ?m; A'-C' 125 ?m. |
Expression Data
Expression Detail
Antibody Labeling
Phenotype Data
| Fish: | |
|---|---|
| Knockdown Reagent: | |
| Observed In: | |
| Stage: | Day 4 |
Phenotype Detail
Acknowledgments
This image is the copyrighted work of the attributed author or publisher, and
ZFIN has permission only to display this image to its users.
Additional permissions should be obtained from the applicable author or publisher of the image.
Full text @ PLoS One