
Fig. 3
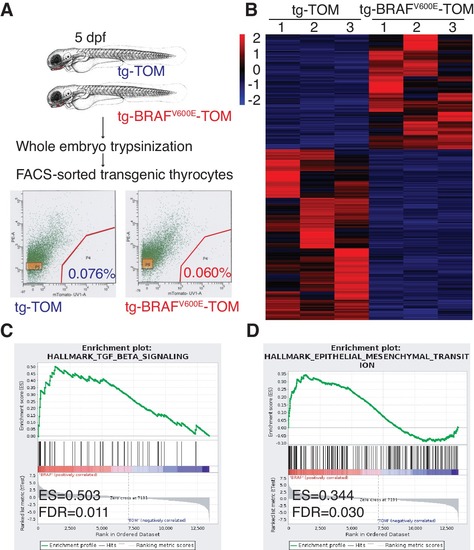
BRAFV600E expression in thyrocytes leads to transcriptional upregulation in genes associated with EMT and TGF-? signaling. (A) Schematic diagram of the FACS-sorting workflow with the experimental plots indicating the percentage of TdTomato-positive cells sorted from tg-TOM and tg-BRAFV600E-TOM. (B) Heat-map depicting top differentially expressed genes (Figure 3?source data 1) in sorted tg-BRAFV600E-TOM compared to tg-TOM. (C,D) Gene set enrichment plots of TGF-? and EMT signatures from RNAseq performed on sorted thyrocytes from tg-BRAFV600E-TOM and tg-TOM larvae (E.S.=0.503, FDR = 0.011, nominal p-val = 0.002 and E.S.=0.344, FDR = 0.035, nominal p-val = 0.0, respectively). |