Fig. 5
- ID
- ZDB-FIG-170309-7
- Publication
- Reinig et al., 2017 - The Descending Diencephalic Dopamine System Is Tuned to Sensory Stimuli
- Other Figures
- All Figure Page
- Back to All Figure Page
|
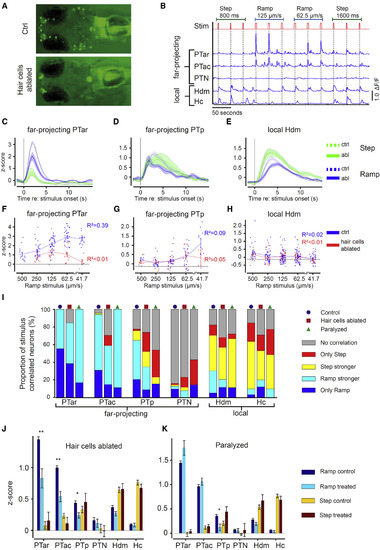
Lateral Line Ablation Results in Loss of Stimulus Speed Tuning and in Attenuated Mechanosensory-Related Activity (A) Vital DASPEI stain visualizes hair cells and confirms their ablation in a neomycin-treated 5-dpf-old larva (neomycin incubation: 125 ?M, 1 hr). (B) ?F/F calcium activity of diencephalic dopaminergic neurons during tactile stimulation (Stim) trials in hair cell-ablated 5 dpf th:Gal4VP16; UAS:GCaMP7a larva. (C?E) The mean stimulus-evoked calcium activity (z-score) of stimulus-correlated neurons is plotted against time after stimulus onset for Ramp (blue) and Step (green) stimulation and for the different dopaminergic subgroups PTar (C), PTp (D), and Hdm (E). The solid line corresponds to dopaminergic activity in hair-cell-ablated larvae (abl), and the dashed line to dopaminergic activity in control larvae (ctrl). Shaded areas indicate SEM. (F?H) The mean time- and trial-averaged calcium activity (z-score) of all tactile stimulus-correlated dopaminergic neurons in response to different Ramp speeds in locomotion-free trials for the different dopaminergic subgroups PTar (F), PTp (G), and Hdm (H). The dots represent the mean calcium responses of single cells to a certain indicated speed of the Ramp stimulus. The black dashed lines mark the baseline activity (i.e., the average z-score for the 5 s preceding stimulation). Error bars indicate SEM. (I) The proportion of neurons correlated to tactile stimulation in control, hair-cell-ablated, and paralyzed larvae for Ramp and Step stimuli. (J) The mean calcium activity (z-score) of tactile stimulus-correlated neurons for all dopaminergic subgroups in control larvae and hair-cell-ablated larvae. (K) The mean calcium activity (z-score) of all neurons for all dopaminergic subgroups in control larvae and paralyzed larvae. Error bars indicate SEM. ?p < 0.05; ??p < 0.01, by Mann-Whitney U test with Bonferroni correction (comparisons, n = 6). See also Figure S6. |

