Fig. S1
- ID
- ZDB-FIG-170309-10
- Publication
- Reinig et al., 2017 - The Descending Diencephalic Dopamine System Is Tuned to Sensory Stimuli
- Other Figures
- All Figure Page
- Back to All Figure Page
|
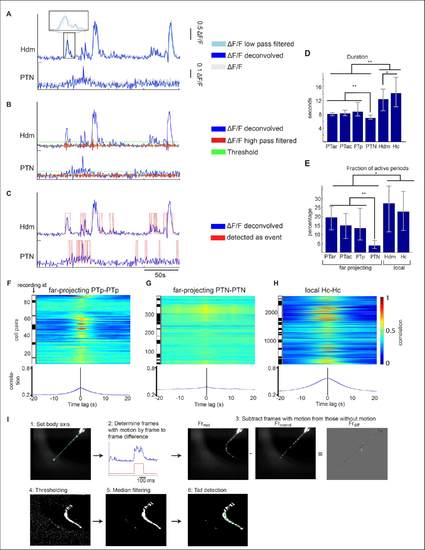
(A-C) Calcium event detection method. (A) First, ΔF/F fluorescent traces (dashed gray) were low-pass filtered (cyan) and deconvolved (blue) by an exponential filter exp(-t/ τdecay ). The signals of a PTN and a Hdm cell are plotted as examples. (B) Then the noise level of the ΔF/F trace was determined by high-pass filtering (red line) and calculating the standard deviation. A threshold (green line) was set at 3 times the standard deviation. (C) All fluorescent values (low-pass filtered deconvolved ΔF/F) exceeding this threshold and continuing longer than 1 second (2 frames) were recognized as calcium event. (D) The median duration of calcium events for all dopaminergic subgroups. The error bars represent the 25% and 75% quantiles. (E) The median fraction of active time periods in percent. The error bars represent the 25% and 75% quantiles. **significant by Mann-Whitney-U-test (**p<0.01, *p<0.05, Bonferroni corrected; comparisons n=15. There was no significant difference between PTar and Hdm groups regarding the fraction of active time periods (p=0.01, > 0.05/15=0.003)). (F-H). Cross-correlations of single cell pairs of PTp, PTN and Hc cells. The cross-correlation is normalized between 0 to 1, which means if 2 cell pairs have the same activity pattern (e.g. in an autocorrelation) the cross-correlation at time point t = 0 s is 1. (I) Tail motion detection procedure from high-speed tail motion recordings of larval zebrafish. (1) The body axis and the tail line were defined (green line). (2) The absolute frame to frame difference of a high-speed camera recording of the tail (blue line) was determined. The red line represents the classification of time frames with and without tail motion. (3) From every frame with tail motion the median of the frames without tail motion was subtracted. (4) Based on a dynamical threshold (see methods, tail motion detection) pixels which are potentially part of the tail (white, denominated as ”tail pixels”) are determined. (5) Spatial median filtering was applied to remove noise. (6) The tail position was detected by a chain of midpoints (green) by maximizing the number of tail pixels in the neighborhood of each midpoint position. |

