
Fig. 5
- ID
- ZDB-FIG-161018-5
- Publication
- Lu et al., 2016 - IGFBP1 increases ?-cell regeneration by promoting ?- to ?-cell transdifferentiation
- Other Figures
- All Figure Page
- Back to All Figure Page
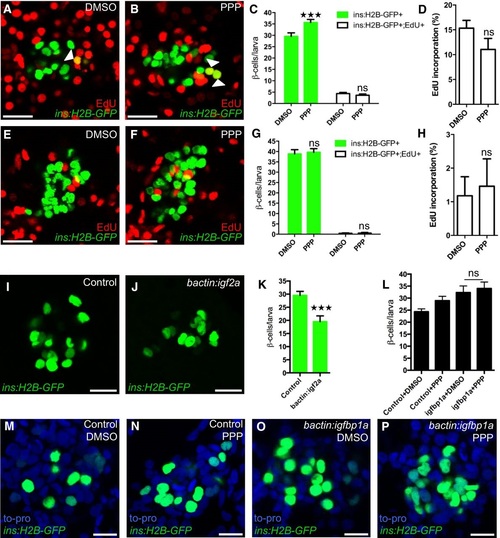
Inhibition of the Igf pathway mimics Igfbp1a′s stimulatory effect on βcell regeneration A-H. PPP, an IGF1R inhibitor, promotes βcell regeneration. Tg(ins:H2BGFP);Tg(ins:FlagNTR) larvae were treated with MTZ from 3 to 4 dpf to ablate the β cells and then treated with EdU and DMSO or with EdU and PPP during regeneration from 4 to 6 dpf. Representative confocal images (A, B) at 6 dpf of DMSO and PPPtreated larvae displaying β cells in green and the β cells that had incorporated EdU as yellow overlap (arrowheads). (C) Quantification of the total number of β cells (green bars) at 6 dpf, and β cells that had incorporated EdU (white bars) from 4 to 6 dpf during βcell regeneration. ***P = 0.0003, P = 0.8607, respectively. (D) Rate of βcell proliferation displayed as the percentage of β cells that incorporated EdU. P = 0.1194. n = 18 larvae for the DMSOtreated group, n = 17 larvae for the PPPtreated group. (E-H) To examine whether PPP affected βcell proliferation during regular development, Tg(ins:H2BGFP) larvae were treated with EdU and DMSO or PPP from 4 to 6 dpf. Representative confocal images (E, F) of 6 dpf DMSO and PPPtreated larvae displaying β cells in green and the β cells that had incorporated EdU as yellow overlap. Scale bars: 20 �m. (G) Quantification of the total number of β cells (green bars) and β cells that had incorporated EdU (white bars) per larva from 4 to 6 dpf. P = 0.9098 and 0.9976, respectively. (H) Rate of βcell proliferation displayed as the percentage of β cells that incorporated EdU. P = 0.7822. n = 16 larvae for DMSOtreated group, 18 larvae for PPPtreated group. I-K. Activation of the Igf pathway reduces βcell regeneration. Control and bactin:igf2aoverexpressing Tg(ins:H2BGFP);Tg(ins:FlagNTR) larvae were treated with MTZ from 3 to 4 dpf to ablate β cells and subsequently let to regenerate from 4 to 6 dpf. Representative confocal images (I, J) of 6 dpf control and bactin:igf2aoverexpressing larva displaying β cells in green. Scale bars: 15 �m. (K) Quantification of the total number of β cells per larva at 6 dpf following βcell regeneration from 4 to 6 dpf. ***P < 0.0001. n = 28 larvae for control, n = 15 larvae for bactin:igf2a. L-P. No synergistic effect was observed for igfbp1a and PPP. Control and bactin:igfbp1aoverexpressing Tg(ins:H2BGFP);Tg(ins:FlagNTR) larvae were treated with MTZ from 3 to 4 dpf to ablate β cells and subsequently treated with DMSO or PPP during regeneration from 4 to 6 dpf. (L) Quantification of the total number of β cells per larva. n > 10 (n = 23, 20, 14, 13). P = 0.9546. Representative confocal images (M-P) of 6 dpf control or bactin:igfbp1a overexpressing larvae treated with either DMSO or PPP, displaying β cells after 2 days regeneration. Scale bars: 10 �m. |
| Gene: | |
|---|---|
| Fish: | |
| Condition: | |
| Anatomical Term: | |
| Stage: | Day 6 |