
Fig. 4
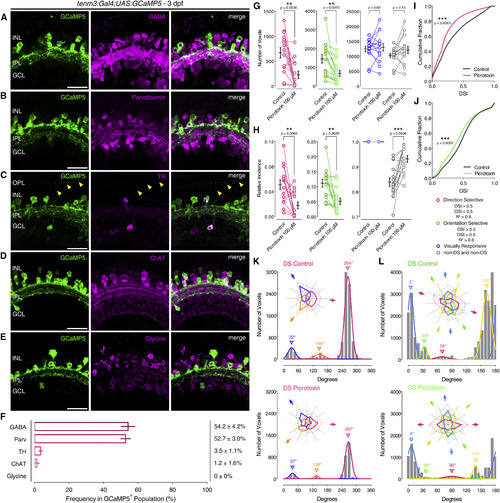
Role of Tenm3+ AC GABAergic Inhibition in RGC Orientation Selectivity (A-E) Immunostaining showing the expression of γ-aminobutyric acid (GABA; A), parvalbumin (B), tyrosine hydroxylase (TH; C), choline acetyltransferase (ChAT; D), and glycine (E) (all in magenta) in 3-dpf Tg(tenm3:Gal4;UAS:GCaMP5) larvae, where tenm3+ ACs are labeled with GCaMP5 (green). Yellow arrowheads indicate neurites of TH+ interplexiform ACs (C). INL, inner nuclear layer; GCL, ganglion cell layer; OPL, outer plexiform layer; IPL, inner plexiform layer. Scale bars, 20 �m. (F) Percentage of GCaMP5+ cells co-localizing with antigen+ cells (mean � SD). GABA, n = 13 retinae; Parvalbumin, n = 10 retinae; TH, n = 9 retinae; ChAT, n = 10 retinae; glycine, n = 5 retinae. (G and H) Average number (G) and relative frequency (H) of DS, OS, visually responsive, and non-DS/non-OS voxels per Z-plane in 4-dpf Tg(isl2b:Gal4;UAS:SyGCaMP3) larvae (n = 15 larvae) before (control) and after (picrotoxin) the application of picrotoxin (100 �M). Error bars, �SEM. **p < 0.01, ***p < 0.001, paired two-tailed Student?s t test. (I and J) Cumulative distributions of DSI values (R2 > 0) across voxels with OSI < 0.5 (I) and OSI values (R2 > 0) across voxels with DSI < 0.5 (J) before (control) and after (picrotoxin) the application of picrotoxin (100 �M). ***p < 0.001, two-sample Kolmogorov-Smirnov test. (K and L) Cumulative histograms summarizing the incidence of preferred angles for identified DS (K) and OS voxels (L) in 4-dpf larvae (n = 15 larvae) before (control) and after (picrotoxin) the application of picrotoxin (100 �M). Overlaid curves are the fitted Gaussian distributions for each DS or OS subtype. Polar plots illustrate the mean (+1 SD) normalized response profiles for each DS or OS subtype. See also Figure S5 and Table S1. |
| Gene: | |
|---|---|
| Antibodies: | |
| Fish: | |
| Anatomical Terms: | |
| Stage: | Protruding-mouth |
| Fish: | |
|---|---|
| Condition: | |
| Observed In: | |
| Stage: | Day 4 |