
Fig. 8
- ID
- ZDB-FIG-160804-3
- Publication
- Houbrechts et al., 2016 - Deiodinase knockdown affects zebrafish eye development at the level of gene expression, morphology and function
- Other Figures
- All Figure Page
- Back to All Figure Page
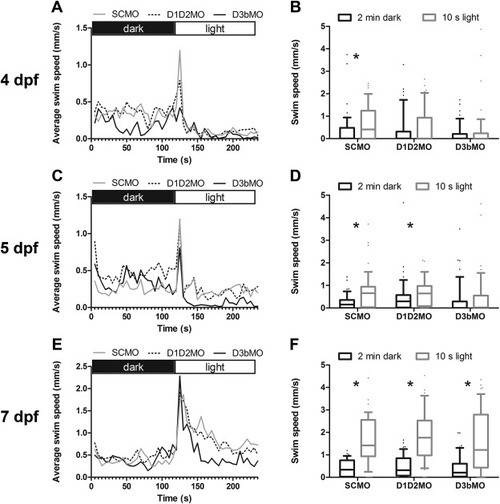
Analysis of the light response in control and deiodinase KD larvae. The light response was analyzed at 4 dpf (A,B), 5 dpf (C,D) and 7 dpf (E,F). The left column depicts average activity patterns for the different conditions throughout the test period. The right column specifically compares activity in the last 2 min in the dark with activity during the first 10 s of light. Boxes show median with 25th and 75th percentiles. Whiskers represent 10th and 90th percentiles. Statistical comparisons were made using wilcoxon-matched pairs signed rank test. *: significant difference between activity in dark and light, i.e. significant light response (p<0.05). SCMO: control group, D1D2MO: KD of D1+D2; D3bMO: KD of D3b. |
| Fish: | |
|---|---|
| Knockdown Reagents: | |
| Observed In: | |
| Stage Range: | Day 4 to Days 7-13 |
Reprinted from Molecular and Cellular Endocrinology, 424, Houbrechts, A.M., Vergauwen, L., Bagci, E., Van Houcke, J., Heijlen, M., Kulemeka, B., Hyde, D.R., Knapen, D., Darras, V.M., Deiodinase knockdown affects zebrafish eye development at the level of gene expression, morphology and function, 81-93, Copyright (2016) with permission from Elsevier. Full text @ Mol. Cell. Endocrinol.