Fig. 1
- ID
- ZDB-FIG-160426-1
- Publication
- Berg et al., 2016 - Lysosomal Disorders Drive Susceptibility to Tuberculosis by Compromising Macrophage Migration
- Other Figures
- All Figure Page
- Back to All Figure Page
|
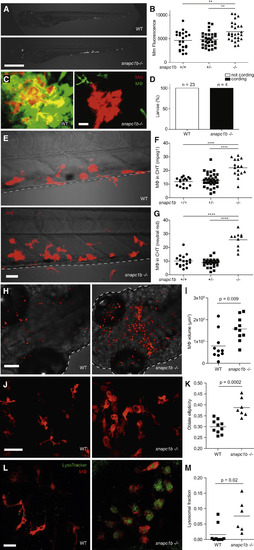
snapc1b Mutants Are Hypersusceptible to M. marinum and Have Increased Numbers of Macrophages that Display Vacuolated Morphology (A) Representative images of wild-type (WT) and snapc1bfh111/fh111 mutant larvae 4 days post-infection (dpi) with 150 M. marinum (Mm). Scale bar, 300 Ám. (B) Quantification of Mm burden measured by fluorescence in snapc1bfh111/+ incross larvae at 5 dpi with 240 Mm. (C) Confocal images of green fluorescent macrophages (MΦ) and red fluorescent bacteria in intact granulomas of WT larvae and extracellular corded bacteria following complete granuloma breakdown in snapc1b mutant larva at 2 dpi with 200 Mm. Scale bar, 15 Ám. (D) Quantification of bacterial cording in larvae from an incross of snapc1bfh111/+ parents at 5 dpi with 200 Mm. (E) Confocal images of the caudal hematopoietic tissue (CHT) of representative WT and snapc1b mutant larvae with red fluorescent macrophages at 6 days post-fertilization (dpf). Scale bar, 20 Ám. (F and G) Quantification of fluorescent macrophages (F) and neutral red-stained cells (G) in the CHT of snapc1bfh111/+ incross larvae at 6 dpf. (H) Confocal images of fluorescent macrophages in the head of representative WT and snapc1b mutant larvae at 3 dpf. Dotted lines indicate the outline of larvae. Scale bar, 100 Ám. (I) Total macrophage volume in the brains of WT and snapc1b mutant larvae at 5 dpf. Volumetric analysis performed from 3D confocal images on red fluorescence signal. (J) Confocal images of fluorescent macrophages in the brain of WT and snapc1b mutant larvae at 3 dpf. Scale bar, 60 Ám. (K) Measurement of oblate ellipticity of macrophages in the brains of WT and snapc1b mutant larvae at 3 dpf. (L) Confocal images red fluorescent macrophages stained with LysoTracker green in the brains of 3 dpf WT and snapc1b mutant larvae. Scale bar, 30 Ám. (M) Average lysosomal volume per animal normalized to total macrophage volume. Macrophage and lysosomal volumes were determined by volumetric analysis of red fluorescence (macrophages) and green fluorescence (lysosomes) in 3D confocal images. Statistical significance was assessed by one-way ANOVA with Sidak?s post-test (B, F, and G) or Student?s t test (I, K, and M). See also Figures S1 and S2, and Tables S2 and S3. |
| Fish: | |
|---|---|
| Condition: | |
| Observed In: | |
| Stage Range: | Protruding-mouth to Days 7-13 |
Reprinted from Cell, 165, Berg, R.D., Levitte, S., O'Sullivan, M.P., O'Leary, S.M., Cambier, C.J., Cameron, J., Takaki, K.K., Moens, C.B., Tobin, D.M., Keane, J., Ramakrishnan, L., Lysosomal Disorders Drive Susceptibility to Tuberculosis by Compromising Macrophage Migration, 139-152, Copyright (2016) with permission from Elsevier. Full text @ Cell

