
FIGURE
Fig. 3
Fig. 3
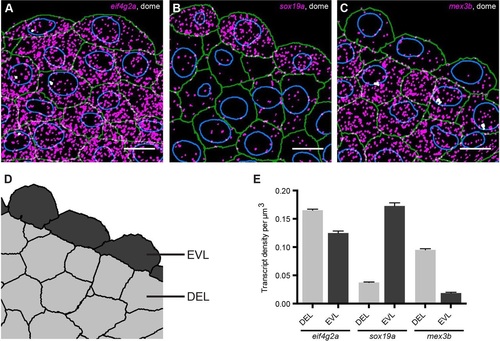
smFISH provides quantitative spatial information on gene expression. Detected transcripts (magenta) and transcription foci (white) for sox19a (A), mex3b (B) and eif4g2a (C) at dome stage. Green, cell outlines; blue, nuclear outlines. Scale bars: 10�m. Images are maximum projections of 17 z-slices spaced by 0.3�m. (D) Tissue mask corresponding to C, to distinguish between EVL and DEL cells. (E) Quantification of transcript levels in DEL and EVL. Values are means from sections of three different embryos. Error bars represent s.e.m. |
Expression Data
| Genes: | |
|---|---|
| Fish: | |
| Anatomical Terms: | |
| Stage: | Dome |
Expression Detail
Antibody Labeling
Phenotype Data
Phenotype Detail
Acknowledgments
This image is the copyrighted work of the attributed author or publisher, and
ZFIN has permission only to display this image to its users.
Additional permissions should be obtained from the applicable author or publisher of the image.
Full text @ Development