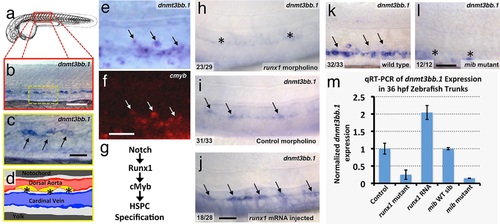
Fig. 1
|
The DNA methyltransferase3bb.1 gene is expressed in developing hematopoietic stem and progenitor cells and is regulated by hematopoietic stem and progenitor cell ( HSPC)-specific pathways. (a) Camera lucida drawing of a 24 hpf zebrafish embryo with a red box noting the approximate region of the trunk shown in in situ hybridization images. (b,c) Whole-mount in situ hybridization of a 36 hpf zebrafish trunk probed for dnmt3bb.1, showing expression in the ventral floor of the dorsal aorta (arrows in panel c). Yellow inset box in panel b indicates the magnified area shown in panel c. (d) Diagram corresponding to panel c showing dorsal aorta (red), cardinal vein (blue), and dnmt-positive cells in the floor of the dorsal aorta (yellow). (e,f) Double in situ hybridization of a 36 hpf zebrafish trunk probed for dnmt3bb.1 (e, blue) and c-myb (f, red). The c-myb positive HSPC progenitors also stain for dnmt3bb.1 (arrows). (g) A Notch- Runx- c-myb pathway regulates HSPC emergence in the zebrafish. (h-j) In situ hybridization of 36 hpf runx1 morpholino-injected (h), control (i), or runx1 mRNA-injected (j) zebrafish trunks probed for dnmt3bb.1, showing that dnmt3bb.1 expression is reduced by runx1 knockdown (asterisks) and increased by runx1 overexpression (arrows). (k,l) In situ hybridization of 36 hpf wild type (k) or mind bomb mutant (l) zebrafish trunks probed for dnmt3bb.1, showing that dnmt3bb.1 expression seen in wild-type siblings (arrows in panel k) is strongly reduced in Notch-deficient mind bomb mutants (asterisks in panel l). (m) Quantitative reverse transcriptase-polymerase chain reaction (qRT-PCR) analysis of dnmt3bb.1 transcript levels in 36 hpf (i) control, (ii) runx1W84X mutant, (iii) runx1 mRNA injected, (iv) mind bomb (mib) wild type sibling (wild type sibling of mib mutants), and (v) mib mutant zebrafish embryos. dnmt3bb.1 levels are normalized to the reference gene elf1α and to levels in controls. All graphs show mean ▒ standard error of the mean (SEM) and are representative of three biological replicates. Scale bars = 100 Ám in b, h-l and 50 Ám in c, f. |
| Genes: | |
|---|---|
| Fish: | |
| Knockdown Reagent: | |
| Anatomical Terms: | |
| Stage: | Prim-25 |
| Fish: | |
|---|---|
| Knockdown Reagent: | |
| Observed In: | |
| Stage: | Prim-25 |

