
Fig. 6
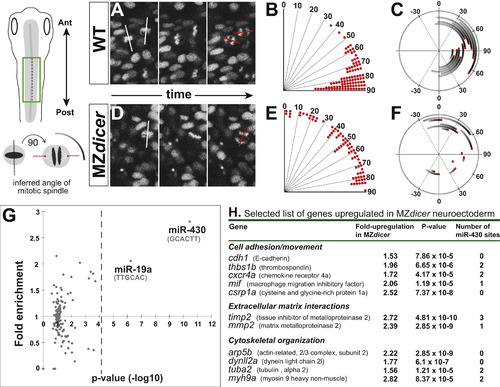
MZdicer neural progenitors undergo misoriented neural rod cell divisions. (A and D) Time-lapse recording from dorsal view (green box in schematic). Histone2A-cherry localizes to chromosomes and enables measurement of mitotic orientation (red lines) at anaphase. White line indicates orientation at initiation of mitosis. (B and E) Quantification of mitotic orientation at anaphase relative to anteroposterior axis (0 degrees) in (B) wildtype (96 cells; 4 embryos) and (E) MZdicer embryos (72 cells; 5 embryos). (C and F) Representation of mitotic spinde rotation for randomly chosen (C) wildtype (n=12) and (F) MZdicer (n=12) progenitors. Inferred spindle orientation (relative to anteroposterior axis) was measured at prophase (start of line) and then again at anaphase (red). (G) miRNA target site (7-mer sites) enrichment in 3′UTRs of upregulated genes (>1.5 fold) in MZdicer neuroectodermal cells. The enrichment of 135 target sites compared to a control set is plotted. The p-value cutoff after multiple test correction is shown as a dashed line. (H) Selected candidate list of upregulated transcripts in MZdicer mutant. Fold-change upregulation and p-value derived from published microarray data ( Shkumatava et al., 2009). (For interpretation of the references to color in this figure legend, the reader is referred to the web version of this article.) |
Reprinted from Developmental Biology, 409(2), Takacs, C.M., Giraldez, A.J., miR-430 regulates oriented cell division during neural tube development in zebrafish, 442-50, Copyright (2016) with permission from Elsevier. Full text @ Dev. Biol.