
FIGURE
Fig. 2
- ID
- ZDB-FIG-160225-46
- Publication
- Bettini et al., 2016 - Histopathological analysis of the olfactory epithelium of zebrafish (Danio rerio) exposed to sublethal doses of urea
- Other Figures
- All Figure Page
- Back to All Figure Page
Fig. 2
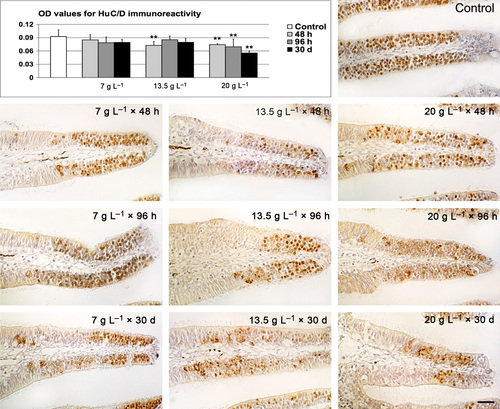
HuC/D immunohistochemistry. (A) Densitometric analysis and comparison between controls and treatments. (B) Representative micrograph of control tissue. (C1?3) Representative micrographs of lamellae exposed to 7 g L-1 of urea. (D1?3) Representative micrographs of lamellae exposed to 13.5 g L-1 of urea. (E1?3) Representative micrographs of lamellae exposed to 20 g L-1 of urea. Significant differences compared with controls are indicated by asterisks: **P < 0.01. Scale bar: 20 �m. OD, optical density. |
Expression Data
Expression Detail
Antibody Labeling
Phenotype Data
Phenotype Detail
Acknowledgments
This image is the copyrighted work of the attributed author or publisher, and
ZFIN has permission only to display this image to its users.
Additional permissions should be obtained from the applicable author or publisher of the image.
Full text @ J. Anat.