
Fig. 3
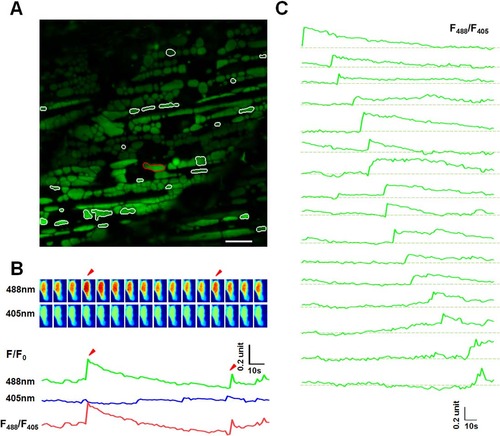
Mitoflash activities in red skeletal muscles of 8 dpf zebrafish embryos. (A) The same as in Fig 2A, except that the data were from a red skeletal muscle at 8 dpf. White contours mark mitochondria undergoing mitoflashes. Scale bar, 10 �m. See also S2 Movie. (B) A representative mitoflash (marked in panel A with red-color coded contour). The same as in in Fig 2B. Arrow heads mark two consecutive mitoflashes in the same mitochondria. Upper panel: time sequence of the mitoflash seen alternatively at 488 nm and 405 nm excitation and their ratio (F488/F405). Note that the ratiometric line plot, F488/F405, largely eliminated motion artifacts. (C) A family of traces showing diversified time courses of mitoflashes from red skeletal muscle at this developmental stage. The traces were arranged by the start points of mitoflash events. Photobleaching (~10%) was corrected based on global intensity decay and the dashed lines mark the basal level. Note the distinct developmental differences compared to mitoflashes in Fig 2D. |
| Gene: | |
|---|---|
| Fish: | |
| Anatomical Term: | |
| Stage: | Days 7-13 |