
Fig. 4
- ID
- ZDB-FIG-150612-4
- Publication
- Hall et al., 2013 - Immunoresponsive Gene 1 Augments Bactericidal Activity of Macrophage-Lineage Cells by Regulating β-Oxidation-Dependent Mitochondrial ROS Production
- Other Figures
- All Figure Page
- Back to All Figure Page
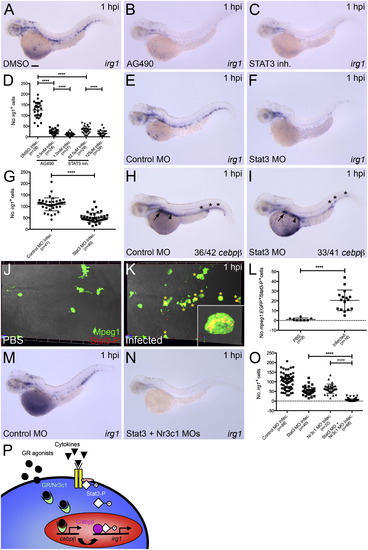
JAK/STAT Pathway Cooperates with Glucocorticoid Receptor-Mediated Signaling to Regulate Infection-Responsive irg1 Expression within Macrophage-Lineage Cells (A?C) Expression of irg1 within infected DMSO (control)-, AG490 (0.5 mM)-, and STAT3 inhibitor peptide (62.5 �M)-treated larvae, respectively, at 1 hpi. (D) Quantification of irg1+ cells within individual infected larvae treated with DMSO, AG490 (0.5 and 1.0 mM), or STAT3 inhibitor peptide (62.5 and 125 �M), at 1 hpi (mean � SD). (E and F) Expression of irg1 within infected control MO-injected and Stat3-depleted larvae, respectively, at 1 hpi. (G) Quantification of irg1+ cells within individual infected larvae as shown in (E) and (F) (mean � SD). (H and I) Expression of cebpβ within infected control MO-injected and Stat3-depleted larvae, respectively, at 1 hpi. (J and K) Immunofluorescence detection of phosphorylated Stat3 (Stat3-P, Alexa 568) and Mpeg1/EGFP (Alexa 488) within the midbrain/hindbrain region of PBS-injected and infected Tg(mpeg1:EGFP) larvae, respectively, at 1 hpi. Yellow asterisks mark macrophage-lineage cells containing phosphorylated Stat3. (L) Quantification of Stat3-P+ macrophage-lineage cells within the midbrain/hindbrain region of individual larvae as shown in (J) and (K) (mean � SD). Region assessed, 100 �m from dorsal-most surface of midbrain/hindbrain (512 � 512, 50 z sections at 2 �m). (M and N) Expression of irg1 within infected control MO-injected and Stat3 + Nr3c1-depleted larvae, respectively, at 1 hpi. (O) Quantification of irg1+ cells within individual infected control MO-injected, Stat3-depleted, Nr3c1-depleted, and Stat3 + Nr3c1-depleted larvae, at 1 hpi (mean � SD). (P) Schematic illustrating proposed regulation of infection-responsive irg1 expression within macrophage-lineage cells. Asterisks, arrows, and arrowheads mark blood-specific, liver-specific, and gut-specific cebpβ expression, respectively. All views anterior to left. Numbers represent frequency of larvae with displayed phenotype. Scale bar, 100 �m in (A). p < 0.0001. See also Figure S4. |
Reprinted from Cell Metabolism, 18(2), Hall, C.J., Boyle, R.H., Astin, J.W., Flores, M.V., Oehlers, S.H., Sanderson, L.E., Ellett, F., Lieschke, G.J., Crosier, K.E., and Crosier, P.S., Immunoresponsive Gene 1 Augments Bactericidal Activity of Macrophage-Lineage Cells by Regulating β-Oxidation-Dependent Mitochondrial ROS Production, 265-278, Copyright (2013) with permission from Elsevier. Full text @ Cell Metab.