
FIGURE
Fig. S3
- ID
- ZDB-FIG-150511-18
- Publication
- Otis et al., 2015 - Zebrafish as a model for apolipoprotein biology: Comprehensive expression analysis and a role for ApoA-IV in regulating food intake
- Other Figures
- All Figure Page
- Back to All Figure Page
Fig. S3
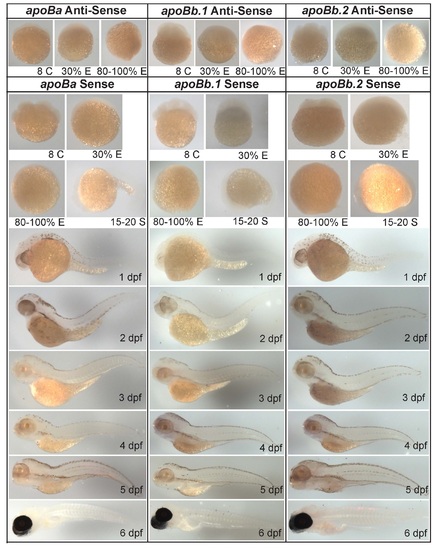
apoBa, apoBb.1, and apoBb.2 in situ hybridization does not reveal mRNA transcripts at the 8-cell (C) stage, 30% epiboly (E), 80% E. No staining was observed for sense probes. Experiments were performed in triplicate on wild type ( 2-5 dpf treated with PTU) and nacre-/- (6 days post-fertilization (dpf)) larvae; n ≥ 5 larvae for each experiment. |
Expression Data
| Genes: | |
|---|---|
| Fish: | |
| Stage Range: | 8-cell to Bud |
Expression Detail
Antibody Labeling
Phenotype Data
Phenotype Detail
Acknowledgments
This image is the copyrighted work of the attributed author or publisher, and
ZFIN has permission only to display this image to its users.
Additional permissions should be obtained from the applicable author or publisher of the image.
Full text @ Dis. Model. Mech.