
Fig. S4
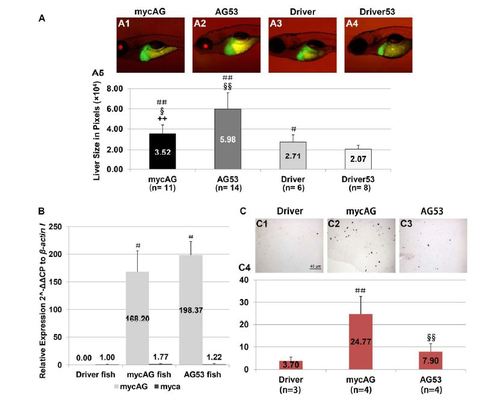
Reduction of apoptosis and acceleration of liver tumor progression in mifepristone-induced mycAG fish with tp53M214K mutation (AG50). (A) Comparison of liver size between mycAG and AG53 larvae. Larvae were induced with 2 µM mifepristone from 3 dpf and photographed at 5 dpi (8 dpf). Liver size was measured based on 2D GFP images as previously described [35]. ## and # indicate significant difference with p-values of 0.01 and 0.05 respectively when compared with the liver size in the Driver53 (Driver fish in tp53M214K mutation background). §§ and § indicate significant difference with p-values of 0.01 and 0.05 respectively when compared with the liver size in the Driver. ++ indicates significant difference (P < 0.01) when compared with the liver size in AG53. (B) Induction of mycAG expression in mycAG and AG53 fish. Total RNA was extracted from 5 dpi/8 dpf larvae treated with 2 µM mifepristone for RT-qPCR analyses. Each group has three biological replicates and there was no significant effect on induction of mycAG mRNA by tp53M214K mutation. # indicates the expression differences when compared to endogenous myca expression in Driver fish (p < 0.05). (C) Apoptosis in AG53 and mycAG fish livers. Liver sections from 2 mpi (3 mpf) driver, mycAg and AG50 fish were used for TUNEL staining. Each group has 3 to 4 biological replicates and apoptosis was counted and represented in column. , indicates the difference in proliferation when compared with Driver is significant (P < 0.01). §§ indicates significant difference between mycAG and AG50 fish (P < 0.01). |