Fig. 4
|
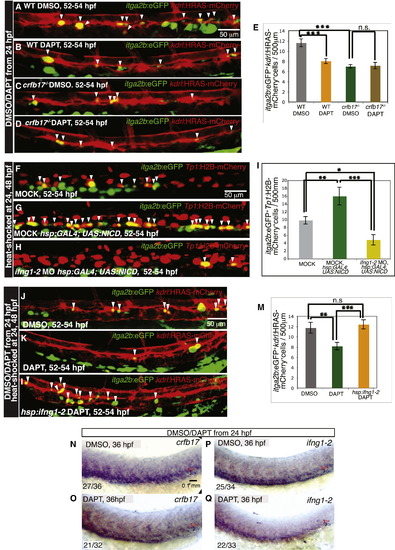
Ifng1-2 Functions Downstream of Notch Signaling during HSC Development (A–E) Notch inhibition has no additional effect on HSC impairment in crfb17 mutants. HSCs are identified by Tg(itga2b:EGFP) (green) and Tg(kdrl:HRAS-mCherry) (red) expression (white arrowheads) in DMSO-treated (A) or DAPT-treated (B) WT and DMSO-treated (C) or DAPT-treated (D) crfb17/ embryos. Siblings were imaged at 52–54 hpf, and HSC numbers were analyzed prior to genotyping. (E) itga2b:EGFP+kdrl:HRAS-mCherry+ cells per 500 µm aortic length. Values represent means ± SEM, n = 12–13 embryos. (F–I) Reduced efficiency of Notch signaling to induce HSCs in the absence of Ifng1-2. itga2b:EGFP+ cells (green) are observed in the ventral wall of the dorsal aorta of mock-injected control (F) and Tg(hsp:GAL4;UAS:NICD-myc) embryos (G), and ifng1-2 MO-injected Tg(hsp:GAL4;UAS:NICD-myc) embryos (H). Elevated NICD was visualized by Tg(Tp1:H2B-mCherry) expression (red). White arrowheads point to itga2b:EGFP+Tp1:H2B-mCherry+ cells. (I) itga2b:EGFP+Tp1:H2B-mCherry+ cells per 500 µM aortic length. Values represent means ± SEM, n = 8–24 embryos, p d 0.05, p d 0.01, p d 0.001. (J–M) ifng1-2 overexpression rescues the reduction of HSCs caused by Notch inhibition. itga2b:EGFP+ (green) kdrl:HRAS-mCherry+ (red) HSCs (white arrowheads) are imaged in control animals treated with DMSO (J) and DAPT (K) and DAPT-treated Tg(hsp:ifng1-2) animals (L). HSC numbers per 500 µm aortic length are shown as means ± SEM, n = 22–33 embryos, n.s. p > 0.05, p d 0.05, p d 0.01, p d 0.001. All heat-shock treatments were done at 24 and 48 hpf, and all embryos were imaged at 52–54 hpf. (N–Q) Inhibition of Notch signaling downregulates crfb17 and ifng1-2 expression. crfb17 (N and O) and ifng1-2 (P and Q) expression is shown in 36 hpf embryos treated with DMSO (N and P) or DAPT (O and Q) starting at 24 hpf. The number of embryos showing the representative phenotype per total number of embryos analyzed is indicated in the lower left corner. Red brackets identify the dorsal aorta (DA), and blue brackets identify the cardinal vein (CV). All images are lateral views, dorsal up and anterior to the left. |
| Genes: | |
|---|---|
| Fish: | |
| Conditions: | |
| Knockdown Reagent: | |
| Anatomical Terms: | |
| Stage Range: | Prim-25 to Long-pec |
| Fish: | |
|---|---|
| Conditions: | |
| Knockdown Reagent: | |
| Observed In: | |
| Stage: | Long-pec |
Reprinted from Developmental Cell, 31, Sawamiphak, S., Kontarakis, Z., Stainier, D.Y., Interferon Gamma Signaling Positively Regulates Hematopoietic Stem Cell Emergence, 640-653, Copyright (2014) with permission from Elsevier. Full text @ Dev. Cell

