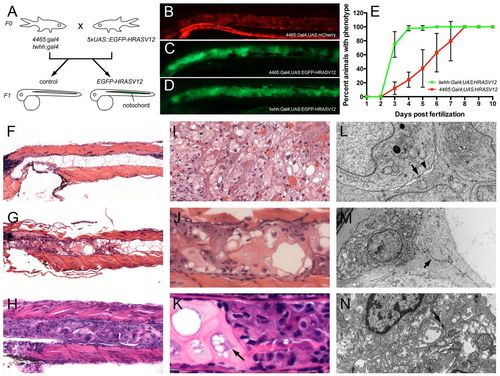
A novel zebrafish model of chordoma. (A) Notochord-specific Gal4 lines (4465:Gal4 and twhh:Gal4) were independently crossed to UAS:EGFP-HRASV12 heterozygous fish, resulting in the embryos shown in B?D. (B) Control notochord of 4465:Gal4,UAS:mCherry embryos; (C) notochord of 4465:Gal4;UAS:EGFP-HRASV12; (D) notochord of twhh:Gal4;UAS:EGFP-HRASV12. HRASV12 gene transactivation was monitored via GFP in the notochord (C,D). (B-D) Disorganized growth of notochord tissue is evident in C and D compared with a normal ?stack of coins? notochord appearance in 4465:Gal4,UAS:mCherry embryos (B). The abnormal notochord phenotype was evident as early as 3 dpf (data not shown), and progressively increased with age, with 100% of larvae involved by 8 dpf. (B?D) Pictures are representatives from 10 dpf old animals. (E) The phenotype progressed much faster in twhh:Gal4;UAS:HRASV12 compared with 4465:Gal4;UAS:HRASV12. (F?N) Histological and ultrastructural examination revealed the presence of a chordoma-like notochord tumor in the transgenic larvae. (F) At 7 dpf, control animals displayed a normal notochord with large vacuolated spaces, thin cytoplasmic septae and bland nuclei. In contrast, 4465:Gal4;UAS:HRASV12 (G,J) and twhh:Gal4;UAS:HRASV12 (H,K) fish showed a replacement of the notochord by a chordoma-like tumor (compare with an example of human chordoma in I). (L) The tumor cells displayed characteristic desmosomal junctions (arrow) with the formation of ?windows? between neighboring cells (arrowhead), which is a common characteristic of human chordomas. In addition, the tumor cells displayed a prominent rough endoplasmic reticulum (ER). (M) The tumor cells often lifted the notochord cells from the basement membrane while still attached to them by numerous desmosomal junctions, which are a part of notochord normal anatomy (arrow). (N) An example of human chordoma showing desmosomal junctions (arrow).
|

