- Title
-
A zebrafish model of chordoma initiated by notochord-driven expression of HRASV12
- Authors
- Burger, A., Vasilyev, A., Tomar, R., Selig, M.K., Nielsen, G.P., Peterson, R.T., Drummond, I.A., and Haber, D.A.
- Source
- Full text @ Dis. Model. Mech.
|
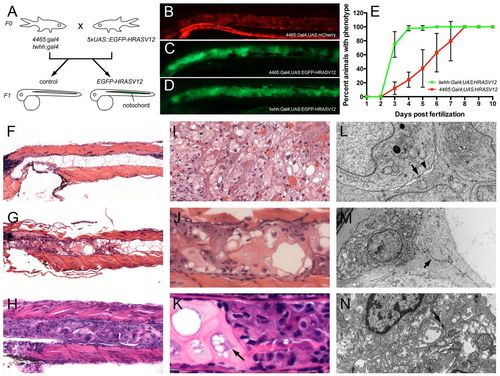
A novel zebrafish model of chordoma. (A) Notochord-specific Gal4 lines (4465:Gal4 and twhh:Gal4) were independently crossed to UAS:EGFP-HRASV12 heterozygous fish, resulting in the embryos shown in B?D. (B) Control notochord of 4465:Gal4,UAS:mCherry embryos; (C) notochord of 4465:Gal4;UAS:EGFP-HRASV12; (D) notochord of twhh:Gal4;UAS:EGFP-HRASV12. HRASV12 gene transactivation was monitored via GFP in the notochord (C,D). (B-D) Disorganized growth of notochord tissue is evident in C and D compared with a normal ?stack of coins? notochord appearance in 4465:Gal4,UAS:mCherry embryos (B). The abnormal notochord phenotype was evident as early as 3 dpf (data not shown), and progressively increased with age, with 100% of larvae involved by 8 dpf. (B?D) Pictures are representatives from 10 dpf old animals. (E) The phenotype progressed much faster in twhh:Gal4;UAS:HRASV12 compared with 4465:Gal4;UAS:HRASV12. (F?N) Histological and ultrastructural examination revealed the presence of a chordoma-like notochord tumor in the transgenic larvae. (F) At 7 dpf, control animals displayed a normal notochord with large vacuolated spaces, thin cytoplasmic septae and bland nuclei. In contrast, 4465:Gal4;UAS:HRASV12 (G,J) and twhh:Gal4;UAS:HRASV12 (H,K) fish showed a replacement of the notochord by a chordoma-like tumor (compare with an example of human chordoma in I). (L) The tumor cells displayed characteristic desmosomal junctions (arrow) with the formation of ?windows? between neighboring cells (arrowhead), which is a common characteristic of human chordomas. In addition, the tumor cells displayed a prominent rough endoplasmic reticulum (ER). (M) The tumor cells often lifted the notochord cells from the basement membrane while still attached to them by numerous desmosomal junctions, which are a part of notochord normal anatomy (arrow). (N) An example of human chordoma showing desmosomal junctions (arrow). |
|
Immunohistochemical features of the zebrafish notochord tumors. 7-dpf larvae were examined by immunohistochemical techniques. The left two columns show control and twhh:Gal4;UAS:HRASV12, and the right two columns show control and 4465:Gal4;UAS:HRASV12. (A?D) pERK staining in control embryos (A,C) showed minimal nuclear positivity in the notochord cells. EGFP-HRASV12 embryos showed focal, strong nuclear and weak cytoplasmic positivity in tumor cells (B,D). (E?H) pS6 staining in control embryos was negative in the notochord (E,G), but the tumor cells showed strong nuclear and weak cytoplasmic positivity. (I?L) Cytokeratin staining showed cytoplasmic positivity in normal notochord cells (I,K) and in the tumor (J,L). (M?P) Brachyury staining demonstrated nuclear and, to a lesser extent, cytoplasmic positivity in normal notochord cells (M,O) and in the tumor (N,P). (Q?T) Corresponding histology of normal notochord (Q,S) and the notochord tumor (R,T). |
|
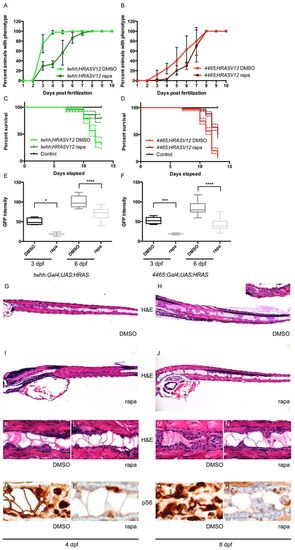
Rapamycin inhibits notochord tumor progression. (A,B) Rapamycin treatment delayed the onset of the zebrafish notochord tumor in both twhh:Gal4;UAS:HRASV12 (A) and 4465:Gal4;UAS:HRASV12 (B) fish. (C,D) The delayed onset of the phenotype correlated with a better survival of rapamycin-treated animals compared with DMSO-treated controls [twhh:Gal4;UAS:HRASV12 (C), P<0.0001 and 4465:Gal4;UAS:HRASV12 (D), P<0.0001]. The dashed lines represent 95% confidence intervals. (E,F) Simple measurement of average GFP intensity in the proximal notochord showed a significant difference between DMSO- and rapamycin-treated twhh:Gal4;UAS:HRASV12 (E) and 4465:Gal4;UAS:HRASV12 (F) zebrafish at 3 and 6 dpf. *P=0.0281; ***P=0.006; ****Pd0.0001. (G?N) The decrease in average GFP intensity was presumably due to reduced tumor growth as shown by H&E staining. (G,K) At 4 dpf, twhh:Gal4;UAS:HRASV12 transgenic embryos already showed a significant tumor formation presenting as solid growth anteriorly and as a more nested growth posteriorly. (I,L) Rapamycin-treated embryos showed only minimal tumor formation at 4 dpf, even anteriorly. (H,M) At 8 dpf, the tumor growth progressed compared with at 4 dpf, and variably involved the entire length of the notochord with severe involvement of the anterior notochord (inset in H), whereas rapamycin-treated embryos showed a much milder, predominantly nested pattern of growth (J,N). Immunohistochemistry showed a focal, but less intense, staining for pS6 in rapamycin-treated animals (P,R) compared with DMSO-treated controls (O,Q). PHENOTYPE:
|
|
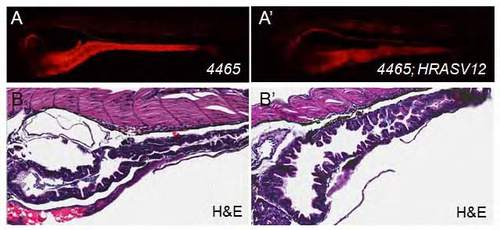
(A) Gross morphology of Tg(mu4465_13:Gal4,UAS:mCherry) using fluorescent microscopy. mCherry is expressed in the gut, kidney, and notochord. (B) H&E staining. (A′, B′) Same as in (A-B), but double transgenic 4465:Gal4;UAS:HRASV12. |
|
No tail (ntl; Brachyury) in situ hybridization of 30 hpf 4465;Gal4 and 4465;HRASV12 embryos. No significant change in ntl-expression upon HRASV12-overexpression, suggesting that Brachyury is independent of HRASV12. In situ hybridization was performed according to standard protocols for zebrafish embryos. |
|
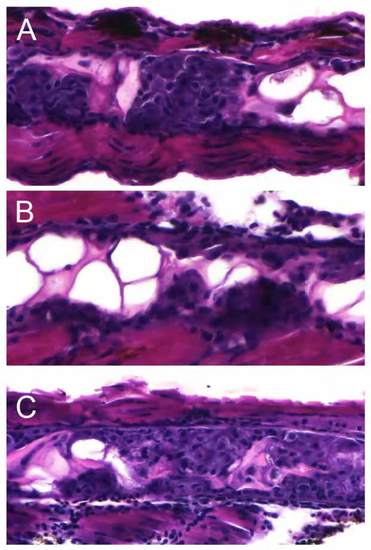
(A) 8 dpf old twwh:HRAS embryos treated with 1% DMSO (control) show the typical tumor phenotype. (B) 8 dpf old twwh:HRAS embryos treated with 15 ÁM LY294002 with slightly reduced tumor load; however, this effect was inconsistent and LY294002 treatment did not result in improved survival (data not shown). (C) 8 dpf old twwh:HRAS embryos treated with 10 ÁM bpV(HOpic). The observed tumor load was similar to that in control fish. |


