
FIGURE
Fig. 3
Fig. 3
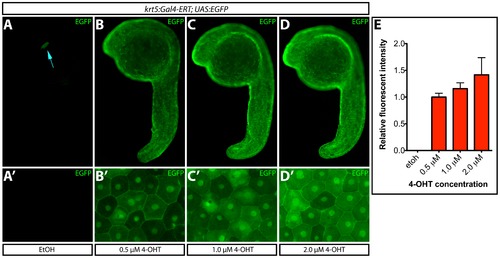
Transgene expression levels depend upon 4-OHT dosage. (A–D) EGFP expression upon treatment of Tg(krt5:Gal4-ERT-VP16; UAS:EGFP) zebrafish with ethanol or the indicated dose of 4-OHT from 4–24 hpf. The blue arrow indicates myl7:ECFP expression. (A2–D2) High-magnification images of ventral epidermis from fish in each treatment group. (E) Normalized EGFP intensity (to the 0.5 μM 4-OHT treated group) of fish treated with ethanol or 4-OHT. Error bars represent standard deviations. |
Expression Data
Expression Detail
Antibody Labeling
Phenotype Data
Phenotype Detail
Acknowledgments
This image is the copyrighted work of the attributed author or publisher, and
ZFIN has permission only to display this image to its users.
Additional permissions should be obtained from the applicable author or publisher of the image.
Full text @ PLoS One