
Fig. 1
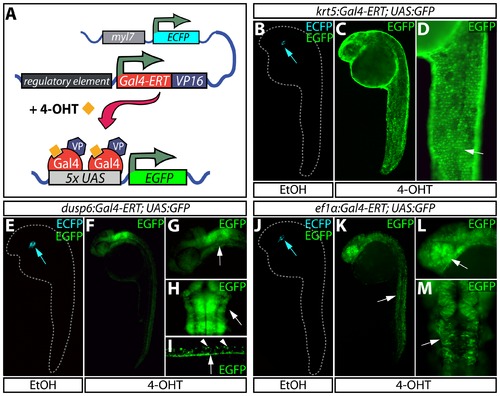
Temporally and spatially controlled transgene expression in zebrafish. (A) Schematic of transgenic constructs used in the Gal4-ERT system. A tamoxifen-responsive Gal4-ERT-VP16 construct is expressed from a tissue-specific promoter that activates any UAS-linked responder line (shown here as a 5xUAS:EGFP reporter) upon tamoxifen or 4-OHT exposure (orange squares). The myl7:ECFP cassette serves as a transgenesis marker for the Gal4-ERT lines. (B–D) Visualization of EGFP expression in Tg(krt5:Gal4-ERT-VP16; UAS:EGFP) animals treated with ethanol (B) or 2 μM 4-OHT (C and D) from 4–24 hpf. The white arrow in panel D highlights expression of EGFP in the epidermis. (E–I) EGFP expression in Tg(dusp6:Gal4-ERT-VP16; UAS:EGFP) animals treated with vehicle (E) or 2 μM 4-OHT (F-I) from 4–24 hpf. In panels G and H, the white arrow indicates EGFP expression in the hindbrain and midbrain-hindbrain boundary. In panel I, arrowheads mark dorsal spinal cord neurons and the arrow points to EGFP expression in the floor plate. (J–M) Expression of EGFP in control (J) and 4-OHT treated (2 μM, K-M) Tg(ef1α:Gal4-ERT-VP16; UAS:EGFP) animals in a variety of cell types throughout the embryo including skeletal muscle (K, white arrow), the eye (L, white arrow), and the midbrain/midbrain-hindbrain boundary (M, white arrow). In panels B, E, and J, blue arrows point to myocardial ECFP expression, which represents the marker for transgenesis and serves as an internal control. |