
Fig. 2
- ID
- ZDB-FIG-140130-1
- Publication
- von Niederhðusern et al., 2013 - Phylogeny and expression of canonical transient receptor potential (TRPC) genes in developing zebrafish
- Other Figures
- All Figure Page
- Back to All Figure Page
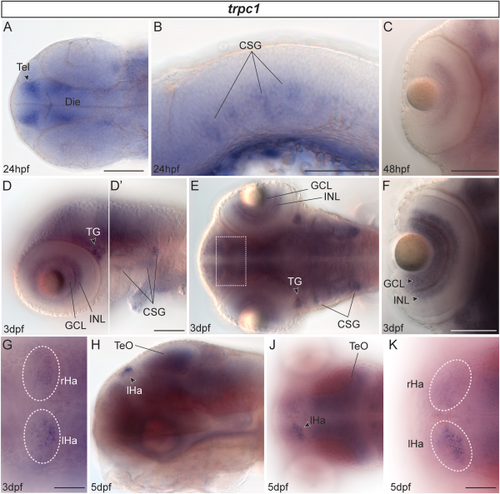
Expression patterns of trpc1 in whole-mount zebrafish. A: Dorsal view of embryonic brain expression 24 hr postfertilization (hpf). B: Lateral close-up of trpc1 expression in CSG 24 hpf. C: Expression of trpc1 in the retinal neuroepithelium in higher magnification 48 hpf; anterior points to the top. D: Lateral view of a larva 3 days postfertilization (dpf) is shown with different focal planes in D and D2. E: Dorsal view of brain expression 3 dpf. F: Staining in the eye of larvae 3 dpf; anterior is up. G: Focus on expression in the habenulae 3 dpf in a dorsal view corresponding to the boxed region in E. Note the differential expression in the left (lHa) and right (rHa) habenula. H: Brain staining in a larva 5 dpf is shown in a lateral view. J.K: Dorsal views on larvae 5 dpf. More cells expressing trpc1 are present in the left compared with the right habenula. Anterior is to the left unless otherwise stated. CSG, cranial sensory ganglia; Die, diencephalon; GCL, ganglion cell layer; INL, inner nuclear layer; Tel, telencephalon; TeO, optic tectum; TG, trigeminal ganglia. Scale bars of 100 çm are indicated in the first picture of a series until changed. The scale bars = 50 çm in G,K. |
| Gene: | |
|---|---|
| Fish: | |
| Anatomical Terms: | |
| Stage Range: | Prim-5 to Day 5 |