|
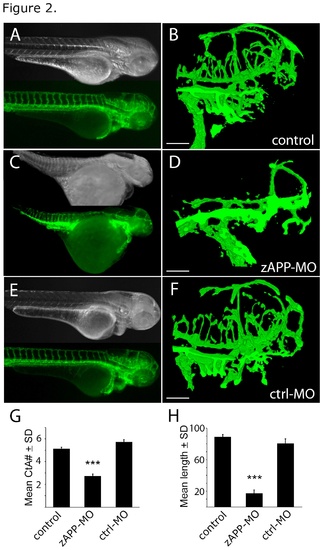
Cerebrovascular defects in APP-deficient zebrafish embryos. (A) Dark field (top) and fluorescence (bottom) images of a control transgenic embryo at 3 dpf shows vascular structures dues to EGFP expression in endothelial cells. (B) Confocal image (projected stack) of cerebrovascular structures in the head of the fish in A. (C) Dark field (top) and fluorescence (bottom) images of a zAPP-MO embryo at 3 dpf. (D) Confocal image (projected stack) of cerebrovascular structures in the head of the fish in C. (E) Dark field (top) and fluorescence (bottom) images of a ctrl-MO embryo at 3 dpf. (F) Confocal image (projected stack) of cerebrovascular structures in the head of the fish in E. (G) Graph showing the number of CtA branches in control (N = 30), zAPP-MO (N = 15), and ctrl-MO (N = 15) zebrafish at 3 dpf (***, P < 8.9e-16). (H) Mean CtA branch lengths in control (N = 28), zAPP-MO (N = 14), and ctrl-MO (N = 8) embryos at 3 dpf (***, P < 9.8e-23); scale bars = 100 μm.
|