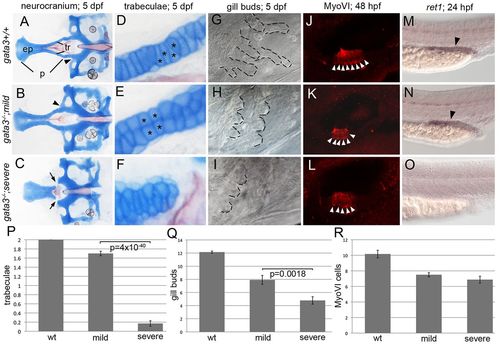
Genetic background influences the gata3 mutant phenotypes. (A–C) Flat-mounted neurocrania and (D–F) close-up views of the trabeculae (tr). In both (A) wild-type embryos and (B) mild gata3 mutants, the palate (p) is fully formed. However, there are rearrangements to the stacking of chondrocytes in mild mutants (asterisks D and E). (C,F) In severe mutants, the trabeculae are lost, generating a gap between the ethmoid plate (ep) and posterior neurocranium. (G–I) gata3 mutation disrupts outgrowth of gill buds (outlined). (H) Mild mutants generate fewer gill buds. (I) In severe mutants, the number of gill buds is further reduced. (J–L) Myosin-VI (MyoVI) labels sensory neurons (arrowheads) in the zebrafish ear. (K,L) Mild and severe mutants have fewer MyoVI -positive cells. (M–O) Wild-type and mutant embryos stained with the ret1 riboprobe. (M,N) ret1 expression is maintained in mild mutants (arrowheads). (O) In severe mutants, ret1 expression is absent. (P–R) Quantification of the defects in gata3 mutant embryos. All graphs show means ± 1 s.e.m. (P) The number of trabeculae per embryo are significantly reduced in severe mutants (average=0.17, s.e.m.=0.06, s.d.=0.46, n=58) compared with mild mutants (average=1.7, s.e.m.=0.05, s.d.=0.55, n=125). Wild-type embryos average=2 trabeculae (s.e.m.=0, s.d.=0, n=654). (Q) The number of gill buds per embryo is also significantly reduced in severe mutants (average=4.79, s.e.m.=0.57, s.d.=2.12, n=14) relative to mild mutants (average=7.92, s.e.m.=0.68, s.d.=2.35, n=12). Wild-type embryos average=12.15 gill buds (s.e.m.=0.17, s.d.=0.75, n=20). (R) Although there is a reduction compared with wild type (average=10.17, s.e.m.=0.49, s.d.=1.70, n=11), the number of MyoVI-positive cells are not significantly altered across mild (average=7.5, s.e.m.=0.27, s.d.=0.85, n=10) and severe (average=6.88, s.e.m.=0.44, s.d.=1.25, n=8) mutants. Anterior to the left; (A–F) dorsal views of flat-mounted neurocrania; (G–O) lateral views of whole-mounted embryos.
|

