
Fig. 4
- ID
- ZDB-FIG-131101-22
- Publication
- Burkhalter et al., 2013 - Grk5l Controls Heart Development by Limiting mTOR Signaling during Symmetry Breaking
- Other Figures
- All Figure Page
- Back to All Figure Page
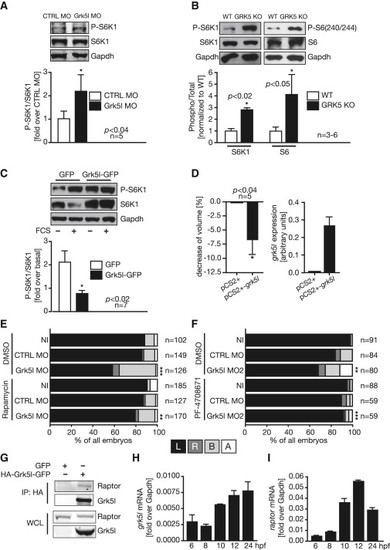
Grk5l Limits mTOR Signaling (A) Western blot analysis of zebrafish embryos (6?8 ss) for S6K1 phosphorylation. Representative images of a single blot are shown. Bar graph displays means � SEM. (B) Western blot of mouse heart lysates of WT and GRK5 KO mice for phosphorylation of S6K1 and its target ribosomal protein S6. Bar graph displays means � SEM. (C) Overexpression of Grk5l-GFP in cells attenuates TORC1 activity toward S6K1. Bar graph displays means � SEM. (D) Cell volume of Grk5l transfected cells (left: mean � SEM). Cells were controlled for grk5l expression (right graph: means � SD, n = 2?3). (E) Reversal of the Grk5l lateralization phenotype by rapa. Analysis of spaw in the presence of DMSO or rapa from 6 to 10 hpf. CTRL MODMSO versus Grk5l MODMSO: p < 0.0001; Grk5l MODMSO versus Grk5l MORapa: p = 0.0033. (F) Inhibition of S6K1 activity by PF-470871 reverses spaw misexpression upon Grk5l KD. CTRL MODMSO versus Grk5l MO2DMSO: p = 0.0063; Grk5l MO2DMSO versus Grk5l MO2PF: p < 0.0001. (G) Coimmunoprecipitation of transfected GFP or hemagglutinin (HA)-Grk5l-GFP and endogenous Raptor using an HA antibody. IP, immunoprecipitation; WCL, whole-cell lysate. (H) Relative expression levels of grk5l obtained by qPCR (mean � SD, n = 2). (I) raptor mRNA levels (mean � SD, n = 2). See also Figures S2, S3, and S4. |
| Antibodies: | |
|---|---|
| Fish: | |
| Knockdown Reagent: | |
| Anatomical Term: | |
| Stage: | 5-9 somites |
| Fish: | |
|---|---|
| Conditions: | |
| Knockdown Reagent: | |
| Observed In: | |
| Stage Range: | 5-9 somites to 20-25 somites |