
FIGURE
Fig. S5
Fig. S5
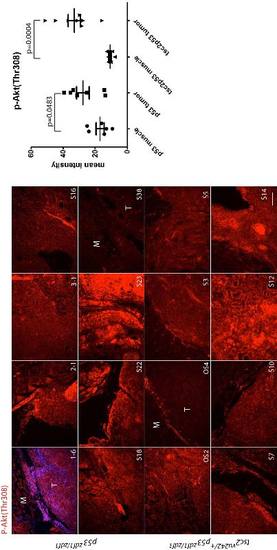
Phospho-Akt Thr308 (red) staining in a series of abdominal tumors from p53zdf1/zdf1 and tsc2;p53 compound mutant zebrafish. (Left) 8 tumor samples per each line were used for comparison. (Right) Mean values of intensity (arbitrary units) were graphed. M, muscle; T, tumor. Scale bar = 100 μm. Student?s t-test was used to assess statistical significance. |
Expression Data
| Antibody: | |
|---|---|
| Fish: | |
| Anatomical Term: | |
| Stage: | Adult |
Expression Detail
Antibody Labeling
Phenotype Data
Phenotype Detail
Acknowledgments
This image is the copyrighted work of the attributed author or publisher, and
ZFIN has permission only to display this image to its users.
Additional permissions should be obtained from the applicable author or publisher of the image.
Full text @ Dis. Model. Mech.