
Fig. 8
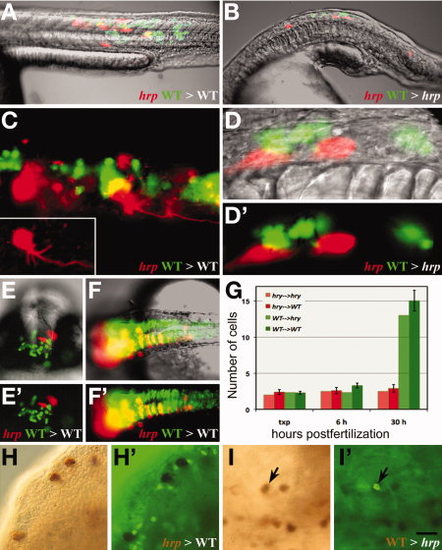
harpy acts both cell autonomously and non-autonomously. A–F: Examples of transplanted wild-type (green) and mutant (red) cells placed in either a wild-type (A,C,E,F) or mutant (B,D) host. A,B: Composite images of a neural and muscle chimera. C: Ultraviolet (UV) image showing a magnified view of neural and muscle chimera in A. Inset shows single harpy interneuron which projected an axon. D: magnified views of neural chimera in B. Note that the wild-type cells did not project axons. E,F: Facial view of telencephalic region (E) and dorsal view of brain (F) neural clones. Note that wild-type cells frequently cross the midline; mutant cells tend to not. G: Comparison of number of cells in clones. For each chimera, two to three cells from two separate individuals were placed into a host embryo at 5 hr, and recorded immediately afterward (txp), then at 6 hr and again at 30 hr. H,I: Mosaic embryos double stained with HRP to detect donor cells (brown/black) and anti-phospho histone H3 to detect mitotic cells (green). H,H2: Labeled mutant cells transferred to an wild-type host; mutant cells are not dividing. I,I2: Labeled wild-type cells transferred to an unlabeled mutant host. A dividing wild-type cell is indicated (arrow). Scale bar = 200 μm in A,B,E,F, 50 μm in C,D, 100 μm in F,I. |