Fig. 1
- ID
- ZDB-FIG-130507-1
- Publication
- Grisham et al., 2013 - Mutations in ap1b1 Cause Mistargeting of the Na(+)/K(+)-ATPase Pump in Sensory Hair Cells
- Other Figures
- All Figure Page
- Back to All Figure Page
|
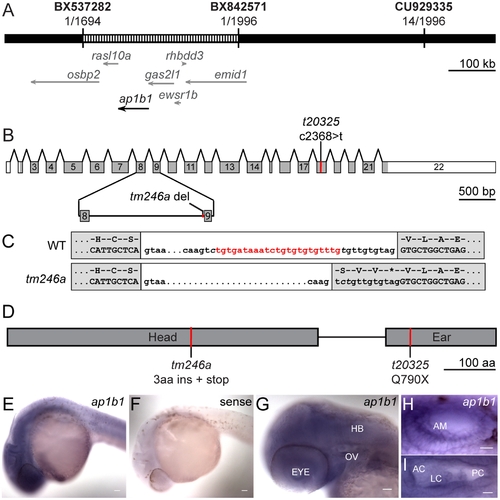
Positional cloning of skylab mutations and expression of ap1b1. A, A diagram of the 330 kb skylab critical interval (striped region) obtained through mapping of the tm246a allele. The critical interval encompasses the coding regions of five annotated genes as well as part of two other genes. B, An exon diagram of the ap1b1 gene. The coding region is depicted in grey and the 52 and 32 UTRs are depicted in white. The locations of the t20325 C-T transition the tm246a 23 bp deletion between exons 8 and 9 are indicated. C, The nucleotides deleted from the splice acceptor site between exons 8 and 9 in the tm246a mutant are highlighted in red in the WT transcript. The resulting translations are shown above the WT and tm246a transcripts. D, Diagram showing the location of tm246a and t20325 mutations in the Ap1b1 protein. E, ap1b1 is expressed ubiquitously at 24 hpf. F, Sense control for ap1b1 in situ experiments. G, Expression of ap1b1 persists in the head at 48 hpf. Scale bars in E-G, 5 μm. H, I, Magnified images of the developing ear at 24 and 48 hpf, respectively. Scale bars in H and I, 10 μm. HB, hindbrain; OV, otic vesicle; AM, anterior macula; AC, anterior crista; LC lateral crista; PC, posterior crista. |
| Gene: | |
|---|---|
| Fish: | |
| Anatomical Terms: | |
| Stage Range: | Prim-5 to Long-pec |

