Fig. 1
- ID
- ZDB-FIG-130405-1
- Publication
- Boglev et al., 2013 - Autophagy induction is a tor- and tp53-independent cell survival response in a zebrafish model of disrupted ribosome biogenesis
- Other Figures
- All Figure Page
- Back to All Figure Page
|
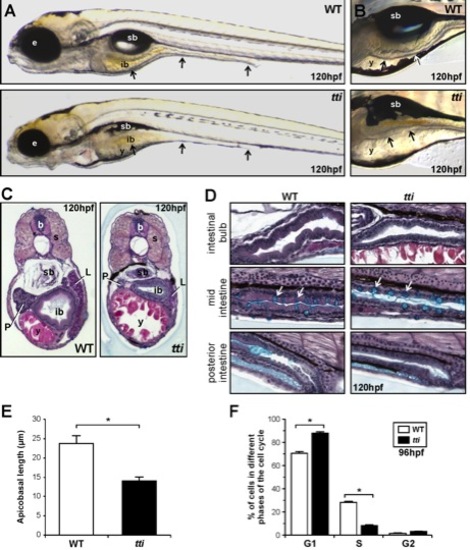
(A, B) Differential interference contrast (DIC) images of WT and ttis450 larvae at 120 hpf. (A) The black arrows indicate, from left to right, the 3 regions of the intestine: the intestinal bulb, mid-intestine and posterior intestine. (B) The intestinal epithelium in WT larvae is extensively folded (upper panel) and is thinner and unfolded in ttis450 larvae (bottom panel). In ttis450, yolk resorption is incomplete and the swim bladder does not inflate. Microphthalmia is evident and the head is slightly smaller and misshapen. (C, D) Transverse (C) and sagittal (D) histological sections of WT and ttis450 larvae at 120 hpf stained with alcian blue periodic acid-Schiff reagent. The anterior part of the intestine (intestinal bulb) is expanded and the epithelium is elaborated into folds in WT larvae (C, left panel). In ttis450 the intestinal bulb, liver and pancreas are smaller than in WT and the epithelium is relatively thin and flat (C, right panel). (D) The intestinal epithelial cells of the entire intestinal tract are columnar in shape in WT larvae (left panels) and are cuboidal in ttis450 (right panels). Goblet cells containing acidic mucins (turquoise staining) are present in approximately equal numbers (white arrows) in the WT and ttis450 mid-intestine. sb, swim bladder; b, brain; ib, intestinal bulb; y, yolk; e, eye; s, somite; P, pancreas; L, liver; (E) The average apicobasal length of the IECs in the intestinal bulb region of ttis450 larvae at 120 hpf is approximately half that of WT IECs. Measurements were performed on 10 cells in 3 independent sections. (F) Fluorescent activated cell sorting analysis of the cell cycle in cells derived from the GFP-positive, endoderm derived organs (liver, pancreas, intestine) of ttis450 and WT larvae on the gutGFP background at 96 hpf. Data are represented as the mean +/ SD (n = 3), *p<0.05. |
| Fish: | |
|---|---|
| Observed In: | |
| Stage: | Day 5 |

