
Fig. 5
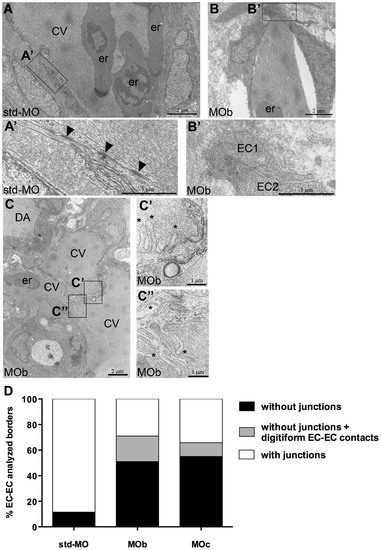
Ultrastructural defects in endothelial cells of zve-ptp morphants at 2 dpf. (A?C) Electron microscopy at the level of the CV plexus of a std-MO (A) and a MOb injected embryo (B, C). (A2?C2, C3) Higher magnifications of the respective boxed areas. (A2) Numerous and extensive junctional complexes are visible in a control embryo. (B2) No junctional complexes are detectable between two ECs in a morphant. All analyzed embryos presented blood circulation. Arrowheads: junctional complexes; asterisks: digitiform EC-EC contact; CV: caudal vein; er: erythrocytes; DA: dorsal aorta; EC: endothelial cell. (D) Quantitative analysis of % EC-EC borders with any type of junctions (adherens and/or tight junctions), without junctions and without junctions but with digitiform EC-EC contacts in controls and in zve-ptp morphants. The graph shows the analysis performed on the acquired images of trunk and tail regions of MOb and MOc injected embryos. We analyzed 112, 150 and 280 EC-EC borders out of three std-MO, seven zve-ptp MOb and five zve-ptp MOc independent injected embryos respectively. |
| Fish: | |
|---|---|
| Knockdown Reagent: | |
| Observed In: | |
| Stage: | Long-pec |