Fig. S3
- ID
- ZDB-FIG-121116-21
- Publication
- Nikolaou et al., 2012 - Parametric functional maps of visual inputs to the tectum
- Other Figures
- All Figure Page
- Back to All Figure Page
|
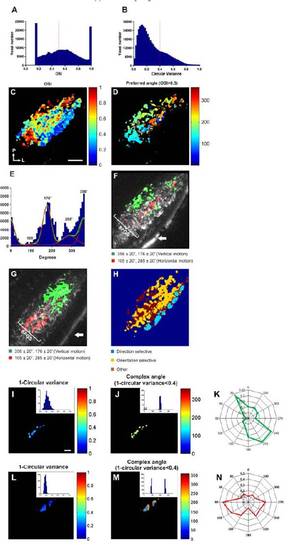
(related to Figure 3). Orientation-selective responses characterised using an orientation selective index (OSI). (A) Histogram showing the distribution of orientationselective indices (OSI) for all responsive voxels. A threshold of 0.5 was used to distinguish orientation-selective voxels (>0.5) from non-selective ones (<0.5, dashed line). For comparison a histogram showing the distribution of 1-circular variance for all responsive voxels is shown in (B). A threshold of 0.4 was used to distinguish orientation-selective voxels (<0.4) from non-selective ones (>0.4, dashed line). (C) Voxel-wise analysis of OSI from a single larva. Voxels are colour-coded according to OSI (scale to the right). Orientation of the image is indicated bottom left (P=posterior, L=lateral). (D) A threshold (OSI>0.5) applied to the map shown in (C) reveals a significant number of orientation-selective voxels. Voxels are colour-coded according to preferred direction of motion (scale to the right). (E) Histogram showing the distribution of preferred motion angles of all orientation-selective voxels. NB the optimal bar orientation is orthogonal to these values. (Data is from 23 different optical sections from 9 larvae). Fitting two summed von-Mises distributions to the histogram data reveals two populations of orientation-selective voxels with population peaks centred at 105º/285º and 176º/356º (F and G) Maps of two larvae showing the two populations of orientation-selective responses centred on von-Mises distributions ±20º (see legend underneath) superimposed onto the mean fluorescence image of SyGCaMP3-expressing axons. Orientation-selective responses occur in the deeper portion of SFGS. The two maps illustrate that the organisation of orientation-selective responses is more variable from animal to animal than direction-selective responses. White arrow indicates skin autofluorescence. (H) Representative tertiary map showing the spatial segregation of direction-selective, orientation-selective and other visually responsive voxels in a single section. (I and L) Voxel-wise analysis of 1-circular variance of single RGCs labelled with SyGCaMP3 in vivo. Voxels are colour coded according to scales on the right. Histograms of data shown in insets. (J and M) Applying a threshold of <0.4 to the maps shown in (I and L) and colour coding voxels according to complex angle (scale to the right) reveals selectivity of the cell for vertical and horizontal motion respectively. Histogram of data shown in insets, and data in polar plot form are shown in (K and N). Scale bar=20 μm in C (for D,F,G,H), and 2 μm in I (for J, L and M). |

