
Fig. S5
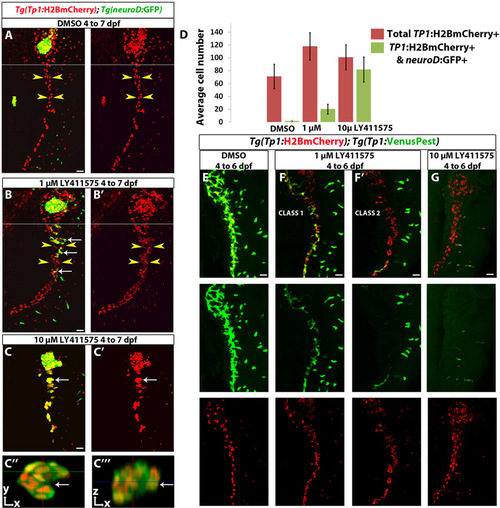
Behavior of NRCs under a moderate and a strong downregulation of Notch signaling. (A-C222) Tg(Tp1:H2BmCherry); Tg(neurod:EGFP) larvae were treated with (A) DMSO, (B) 1 μM LY411575 and (C) 10 μM LY411575. The chemicals were replaced every 24 hours. Compared with DMSO controls, the larvae treated with 1 μM LY411575 exhibited increased numbers of Tg(Tp1:H2BmCherry)+ cells (yellow arrowheads). A small proportion of the NRCs differentiated into endocrine cells, as assessed by Tg(neurod:EGFP) expression (white arrows). A and B show low-magnification projections corresponding to Fig. 4G,H, respectively. (C) In the larvae treated with 10 μM LY411575, the majority of Tg(Tp1:H2BmCherry)+ cells differentiated into endocrine cells, as assessed by Tg(neurod:EGFP) expression. (C22) To better visualize these endocrine cells, a high-magnification single plane through one of the secondary islets (white arrow in C and C2) is shown. (C222) Orthogonal view (z-axis) through the islet across the green line in C22. Note that this cell cluster spans several cell-layers. (D) Quantification of the average number of Tg(Tp1:H2BmCherry)+ cells (red bars) and Tg(Tp1:H2BmCherry); Tg(neurod:EGFP) double-positive cells (green bars) from the experiments in A-C. Tg(Tp1:H2BmCherry)+ and Tg(neurod:EGFP)+ cells posterior to the PI were counted. Larvae treated with 1 μM LY411575 exhibited a significant increase in the total number of Tg(Tp1:H2BmCherry)+ posterior to the PI (118 cells, s.d.=21 cells, n=20 larvae) compared with DMSO controls (71 cells, s.d.=19 cells, n=18 larvae) (P<0.0001); and in these larvae, NRC-derived endocrine cells represented on average 17% (s.d.=7.26%, n=19 larvae) of the total number of NRCs posterior to the PI. In larvae treated with 10 μM LY411575, NRC-derived endocrine cells represented on average 79% (s.d.=12%, n=14 larvae) of the total number of Tg(Tp1:H2BmCherry)+ cells posterior to the PI. These larvae exhibited a more modest increase in the average number of Tg(Tp1:H2BmCherry)+ posterior to the PI (101 cells, s.d.=19.5 cells, n=14 larvae) compared with DMSO controls (P<0.001). (E-G) Tg(Tp1:H2BmCherry); Tg(Tp1:VenusPest) larvae were treated with (E) DMSO, (F) 1 μM LY411575 and (G) 10 μM LY411575 from 4 to 6 dpf. The chemicals were replaced after 24 hours. (E) In the DMSO-treated larvae, the vast majority of NRCs are Tg(Tp1:H2BmCherry)+ and Tg(Tp1:VenusPest)+. (F-F2) In 12 out of 20 larvae treated with 1 μM LY411575 (Class 1), a significant proportion of Tg(Tp1:H2BmCherry)+ cells retained Tg(Tp1:VenusPest) expression, albeit at lower levels compared with DMSO controls. In the rest of the larvae (Class 2), only few Tg(Tp1:H2BmCherry)+ cells retained Tg(Tp1:VenusPest) signal. (G) Larvae treated with 10 �M LY411575 showed complete loss of Tg(Tp1:VenusPest) expression in the pancreatic Tg(Tp1:H2BmCherry)+ cells. All images are lateral views, anterior towards the top, ventral towards the right. Two fields of view were combined, as indicated by a white line to display the full length of the pancreas in A,B. Scale bars: 20 μm. Error bars indicate s.d. |