
Fig. S2
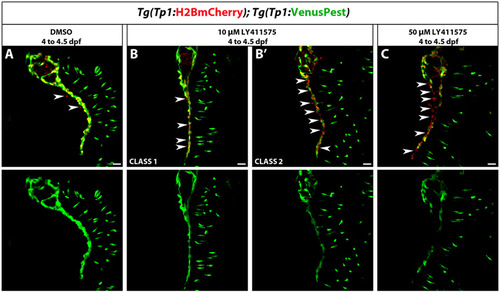
Analysis of Tg(Tp1:VenusPest) expression after a brief period of Notch signaling downregulation. Tg(Tp1:H2BmCherry); Tg(Tp1:VenusPest) larvae were treated with DMSO or LY411575 from 4 to 4.5 dpf. (A) In DMSO-treated larvae, the vast majority of pancreatic NRCs were Tg(Tp1:H2BmCherry)+ and Tg(Tp1:VenusPest)+. (B,B2) Larvae treated with 10 μM LY411575 showed variable donwregulation of Tg(Tp1:VenusPest) expression. (B) Seven out of 10 larvae (Class1) showed minor downregulation of Tg(Tp1:VenusPest) expression. In these larvae, only some Tg(Tp1:H2BmCherry)+ were Tg(Tp1:VenusPest)- (white arrowheads). (B2) Three out of 10 larvae (Class 2) exhibited significant downregulation of Tg(Tp1:VenusPest) expression and multiple Tg(Tp1:H2BmCherry)+ were Tg(Tp1:VenusPest)- compared with DMSO controls (white arrowheads). (C) Larvae treated with 50 μM LY411575 showed consistent downregulation of Tg(Tp1:VenusPest) expression compared with DMSO controls. In these larvae, many Tg(Tp1:H2BmCherry)+ cells were Tg(Tp1:VenusPest)- (white arrowheads). All images are lateral views, anterior towards the top, ventral towards the right; white arrowheads indicate the IPD. The NRCs ventral to the IPD are gut cells. Scale bars: 20 μm. |