
Fig. 4
- ID
- ZDB-FIG-120315-48
- Publication
- Simmons et al., 2012 - Mutation of pescadillo Disrupts Oligodendrocyte Formation in Zebrafish
- Other Figures
- All Figure Page
- Back to All Figure Page
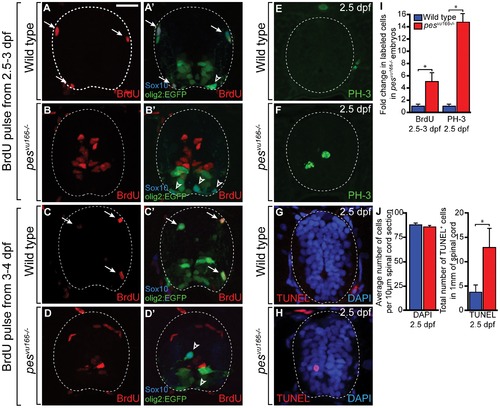
Markers of cell cycle activity are significantly increased in the spinal cords of pesvu166-/- embryos. (A?H) Transverse sections through the spinal cords of 3 dpf (A,B), 4 dpf (C,D) and 2.5 dpf (E?H) larvae processed for immunohistochemistry. (A,C) Wild type spinal cord (dashed line) section showing BrdU+ (arrows) and BrdU- (arrowheads) olig2+, Sox10+ OPCs. (B,D) pesvu166 -/- spinal cord sections. OPCs did not incorporate BrdU but numerous cells lining the central canal and medial septum were BrdU+. (E,F) Representative spinal cord sections showing the M-phase marker PH-3. (G,H) Representative spinal cord sections showing TUNEL labeling (red) to mark apoptotic cells. DAPI labeling (blue) marks cell nuclei. (I) Quantification of the change in total BrdU+ and PH-3+ cells between wild-type and pesvu166 -/- spinal cords. (J) Quantification of DAPI+ and TUNEL+ cells in wild-type and mutant spinal cords. Asterisk (*) indicates pj0.05 by Student′s T-test. |
| Genes: | |
|---|---|
| Antibody: | |
| Fish: | |
| Anatomical Term: | |
| Stage Range: | Pec-fin to Day 4 |
| Fish: | |
|---|---|
| Observed In: | |
| Stage: | Pec-fin |